UNITED STATES
SECURITIES AND EXCHANGE COMMISSION
Washington, D.C. 20549
FORM
CURRENT REPORT
PURSUANT TO SECTION 13 OR 15(d) OF THE SECURITIES EXCHANGE ACT OF 1934
Date
of Report (Date of earliest event reported):
(Exact name of registrant as specified in its charter)
| (State or other jurisdiction of incorporation) | (Commission file number) | (IRS Employer Identification No.) |
(Address of principal executive offices)
Registrant's telephone number, including area code:
(
Not applicable
(Former name or former address, if changed since last report)
Check the appropriate box below if the Form 8-K filing is intended to simultaneously satisfy the filing obligation of the registrant under any of the following provisions:
| Written communications pursuant to Rule 425 under the Securities Act (17 CFR 230.425) |
| Soliciting material pursuant to Rule 14a-12 under the Exchange Act (17 CFR 240.14a-12) |
| Pre-commencement communications pursuant to Rule 14d-2(b) under the Exchange Act (17 CFR 240.14d-2(b)) |
| Pre-commencement communications pursuant to Rule 13e-4(c) under the Exchange Act (17 CFR 240.13e-4(c)) |
Securities registered pursuant to Section 12(b) of the Act:
| Title of Each Class | Trading Symbol(s) | Name of Each Exchange on Which Registered |
Indicate by check mark whether the registrant is an emerging growth company as defined in as defined in Rule 405 of the Securities Act of 1933 (§230.405 of this chapter) or Rule 12b-2 of the Securities Exchange Act of 1934 (§240.12b-2 of this chapter).
Emerging
growth company
If an emerging growth company, indicate by check mark if the registrant has elected not to use the extended transition period for complying with any new or revised financial accounting standards provided pursuant to Section 13(a) of the Exchange Act. ¨
| Item 2.02 | Results of Operations and Financial Condition. |
|
On April 21, 2026, United Community Banks, Inc. (“United Community”) issued a press release announcing financial results for its first fiscal quarter of 2026. The press release is furnished as Exhibit 99.1 to this Current Report on Form 8-K.
The information furnished pursuant to this Item 2.02, including Exhibit 99.1, shall not be deemed “filed” for purposes of Section 18 of the Securities Exchange Act of 1934 (the “Exchange Act”) or otherwise subject to the liabilities under Section 18 of the Exchange Act and shall not be deemed to be incorporated by reference into any filing of the Company under the Securities Act of 1933 or the Exchange Act. | |
| Item 7.01 | Regulation FD Disclosure. |
|
On April 21, 2026, United Community will hold an earnings conference call and webcast at 9:00 a.m. (Eastern Time) to discuss financial results for its first fiscal quarter of 2026. The press release referenced above in Item 2.02 contains information about how to access the conference call and webcast. A copy of the slide presentation to be used during the earnings call and webcast is furnished as Exhibit 99.2 to this Current Report on Form 8-K. The slide presentation also will be available on our website, www.ucbi.com, under the “Investor Relations – Events and Presentations” section.
The information furnished pursuant to this Item 7.01, including Exhibit 99.2, shall not be deemed “filed” for purposes of Section 18 of the Exchange Act or otherwise subject to the liabilities under Section 18 of the Exchange Act and shall not be deemed to be incorporated by reference into any filing of the Company under the Securities Act of 1933 or the Exchange Act. |
| Item 9.01 | Financial Statements and Exhibits. |
| (d) Exhibits |
EXHIBIT INDEX
| Exhibit No. | Description |
| 99.1 | United Community Banks, Inc. Press Release, dated April 21, 2026. |
| 99.2 | Slide presentation to be used during April 21, 2026 earnings call. |
| 104 | The cover page from this Current Report on Form 8-K, formatted in Inline XBRL. |
SIGNATURES
Pursuant to the requirements of the Securities Exchange Act of 1934, the registrant has duly caused this report to be signed on its behalf by the undersigned hereunto duly authorized.
| UNITED COMMUNITY BANKS, INC. | ||
| By: | /s/ Jefferson L. Harralson | |
| Jefferson L. Harralson | ||
| Executive Vice President and | ||
| Chief Financial Officer | ||
| Date: April 21, 2026 | ||
Exhibit 99.1

For Immediate Release
For more information:
Jefferson Harralson
Chief Financial Officer
(864) 240-6208
Jefferson_Harralson@ucbi.com
United Community Banks, Inc. Reports First Quarter Earnings
Earnings and Revenue Growth Year-Over-Year Driven by Profitability Improvement and Solid Loan Growth
GREENVILLE, SC – April 21, 2026 – United Community Banks, Inc. (NYSE: UCB) (United) today announced net income for the first quarter of 2026 of $84.3 million and pre-tax, pre-provision income of $119.2 million. Diluted earnings per share of $0.69 for the quarter represented an increase of $0.11 from the first quarter of 2025 and a decrease of $0.01 from the fourth quarter of 2025.
On an operating basis, United’s diluted earnings per share of $0.70 increased 19% from the year-ago quarter. Strong revenue growth and positive operating leverage drove the year-over-year results.
United’s return on assets was 1.22% on both a GAAP and operating basis in the first quarter of 2026, up from 1.02% and 1.04%, GAAP and operating, respectively, for the first quarter of 2025. Return on common equity was 9.4% and return on tangible common equity on an operating basis was 13.1%. On a pre-tax, pre-provision basis, operating return on assets was 1.73% for the quarter. At quarter-end, tangible common equity to tangible assets was 9.9%, equal to the fourth quarter.
Chairman and CEO Lynn Harton stated, “Our first quarter results mark the start of what we expect to be a great year for United. We continue to improve our earning asset mix by growing loans, funded by maturing investment securities and growth in customer deposits. This shift in earning asset composition and our strategic focus on deposit pricing helped to widen our net interest margin by three basis points in the first quarter. In fact, our net interest margin is up 29 basis points when compared to the first quarter of 2025. We entered the year with a small wholesale funding position, but deposit growth allowed that to be completely repaid by the end of the quarter. We took advantage of our strong capital position and repurchased 1.09 million shares of our common stock at an average price of $33.97 per share during the quarter. All our key performance metrics show significant improvement when compared to the first quarter of 2025. With strong capital and liquidity, we notified holders of our remaining $100 million in subordinated debentures of our intent to redeem those securities in the second quarter.
Harton continued, “I’m very proud of our first quarter financial results and also pleased to report that we were notified in March that United had earned its twelfth JD Power award for outstanding customer satisfaction in the Southeast. That is a tremendous accomplishment by our exceptional team of bankers and a testament to the enduring nature and consistency of our strong corporate culture throughout our organization. Congratulations to our entire team for this great recognition of your focus on customer care.”
1
Net charge-offs were $10.4 million or 0.22% annualized of average loans, compared with 0.21% for the first quarter of 2025 and 0.34% for the fourth quarter of 2025. Nonperforming assets were 0.35% of total assets, up slightly from 0.33% for the fourth quarter. Provision for credit losses was $10.9 million for the first quarter, down from $15.4 million a year ago and $13.7 million for the fourth quarter. As of March 31, the allowance for credit losses represents 1.15% of loans, down slightly from 1.16% at December 31, 2025, reflecting more optimism in the economic forecast.
United also announced today the execution of a definitive merger agreement to acquire Peach State Bancshares, Inc. Details of the transaction are described in a separate presentation, filed with the SEC on April 21 and available within the Investor Relations section of United’s website.
First Quarter 2026 Financial Highlights:
| · | EPS of $0.69 was up $0.11 on a GAAP basis compared to first quarter 2025, and EPS of $0.70 was up $0.11, or 19%, on an operating basis |
| · | Net income of $84.3 million and pre-tax, pre-provision income of $119.2 million, up $12.9 million and $12.6 million, respectively, from a year ago |
| · | Total revenue of $276.5 million improved $28.8 million, or 12%, from a year ago |
| · | Net interest margin of 3.65% increased by 29 basis points from a year ago and 3 basis points from the fourth quarter on a lower cost of funds and improving asset mix |
| · | Provision for credit losses was $10.9 million, down $4.6 million from a year ago and $2.8 million from the fourth quarter; allowance for credit losses coverage down slightly to 1.15% of total loans; net charge-offs were $10.4 million, or 0.22% of average loans, annualized |
| · | Noninterest expense was up $5.3 million compared to the fourth quarter on a GAAP basis and up $0.2 million on an operating basis |
| · | Efficiency ratio of 56.7% on a GAAP basis, or 55.7% on an operating basis, improved from a year ago |
| · | Strong loan production led to loan growth of $218 million, up 4.5% annualized, from the fourth quarter |
| · | Mortgage closings of $251 million compared to $187 million in first quarter 2025; mortgage rate locks of $408 million compared to $330 million in first quarter 2025 |
| · | Customer deposits were up $237 million from the fourth quarter |
| · | Return on assets of 1.22% on both a GAAP and operating basis |
| · | Return on common equity and return on tangible common equity on an operating basis were 9.4% and 13.1%, respectively |
| · | Maintained strong capital ratios with preliminary Common Equity Tier 1 of 13.4% |
| · | Quarterly common dividend of $0.25 per share declared during the quarter, up 4% year-over-year |
| · | Repurchased 1.09 million shares of common stock in the first quarter at an average price of $33.97 per share |
Conference Call
United will hold a conference call on Tuesday, April 21, 2026 at 9:00 a.m. EST to discuss the contents of this press release and to share business highlights for the quarter. Participants can pre-register for the conference call by navigating to https://dpregister.com/sreg/10207568/103998c8460. Those without internet access or unable to pre-register may dial in by calling 1-844-676-1337. The conference call also will be webcast and can be accessed by selecting “Events and Presentations” under “News and Events” within the Investor Relations section of the company's website, ucbi.com
2
UNITED COMMUNITY BANKS, INC.
Selected Financial Information
(in thousands, except per share data)
| 2026 | 2025 | First Quarter | ||||||||||||||||||||||
| First Quarter | Fourth Quarter | Third Quarter | Second Quarter | First Quarter | 2026 - 2025 Change | |||||||||||||||||||
| INCOME SUMMARY | ||||||||||||||||||||||||
| Interest revenue | $ | 333,961 | $ | 346,367 | $ | 353,850 | $ | 347,365 | $ | 335,357 | ||||||||||||||
| Interest expense | 101,197 | 108,441 | 120,221 | 121,834 | 123,336 | |||||||||||||||||||
| Net interest revenue | 232,764 | 237,926 | 233,629 | 225,531 | 212,021 | 10 | % | |||||||||||||||||
| Noninterest income | 43,746 | 40,462 | 43,219 | 34,708 | 35,656 | 23 | ||||||||||||||||||
| Total revenue | 276,510 | 278,388 | 276,848 | 260,239 | 247,677 | 12 | ||||||||||||||||||
| Provision for credit losses | 10,853 | 13,662 | 7,907 | 11,818 | 15,419 | (30 | ) | |||||||||||||||||
| Noninterest expense | 157,302 | 152,048 | 150,868 | 147,919 | 141,099 | 11 | ||||||||||||||||||
| Income before income tax expense | 108,355 | 112,678 | 118,073 | 100,502 | 91,159 | 19 | ||||||||||||||||||
| Income tax expense | 24,066 | 26,223 | 26,579 | 21,769 | 19,746 | 22 | ||||||||||||||||||
| Net income | 84,289 | 86,455 | 91,494 | 78,733 | 71,413 | 18 | ||||||||||||||||||
| Non-operating items | 508 | 606 | 3,468 | 4,833 | 1,297 | |||||||||||||||||||
| Income tax benefit of non-operating items | (113 | ) | (133 | ) | (751 | ) | (1,047 | ) | (281 | ) | ||||||||||||||
| Net income - operating (1) | $ | 84,684 | $ | 86,928 | $ | 94,211 | $ | 82,519 | $ | 72,429 | 17 | |||||||||||||
| Pre-tax pre-provision income (5) | $ | 119,208 | $ | 126,340 | $ | 125,980 | $ | 112,320 | $ | 106,578 | 12 | |||||||||||||
| PERFORMANCE MEASURES | ||||||||||||||||||||||||
| Per common share: | ||||||||||||||||||||||||
| Diluted net income - GAAP | $ | 0.69 | $ | 0.70 | $ | 0.70 | $ | 0.63 | $ | 0.58 | 19 | |||||||||||||
| Diluted net income - operating (1) | 0.70 | 0.71 | 0.75 | 0.66 | 0.59 | 19 | ||||||||||||||||||
| Cash dividends declared | 0.25 | 0.25 | 0.25 | 0.24 | 0.24 | 4 | ||||||||||||||||||
| Book value | 30.54 | 30.17 | 29.44 | 28.89 | 28.42 | 7 | ||||||||||||||||||
| Tangible book value (3) | 22.56 | 22.24 | 21.59 | 21.00 | 20.58 | 10 | ||||||||||||||||||
| Key performance ratios: | ||||||||||||||||||||||||
| Return on common equity - GAAP (2)(4) | 9.35 | % | 9.48 | % | 9.20 | % | 8.45 | % | 7.89 | % | ||||||||||||||
| Return on common equity - operating (1)(2)(4) | 9.39 | 9.53 | 9.83 | 8.87 | 8.01 | |||||||||||||||||||
| Return on tangible common equity - operating (1)(2)(3)(4) | 13.05 | 13.31 | 13.56 | 12.34 | 11.21 | |||||||||||||||||||
| Return on assets - GAAP (4) | 1.22 | 1.21 | 1.29 | 1.11 | 1.02 | |||||||||||||||||||
| Return on assets - operating (1)(4) | 1.22 | 1.22 | 1.33 | 1.16 | 1.04 | |||||||||||||||||||
| Return on assets - pre-tax pre-provision, excluding non-operating items(1)(4)(5) | 1.73 | 1.78 | 1.83 | 1.66 | 1.55 | |||||||||||||||||||
| Net interest margin (fully taxable equivalent) (4) | 3.65 | 3.62 | 3.58 | 3.50 | 3.36 | |||||||||||||||||||
| Efficiency ratio - GAAP | 56.66 | 54.40 | 54.30 | 56.69 | 56.74 | |||||||||||||||||||
| Efficiency ratio - operating (1) | 55.65 | 54.19 | 53.05 | 54.84 | 56.22 | |||||||||||||||||||
| Equity to total assets | 12.97 | 12.99 | 12.78 | 12.86 | 12.56 | |||||||||||||||||||
| Tangible common equity to tangible assets (3) | 9.92 | 9.92 | 9.71 | 9.45 | 9.18 | |||||||||||||||||||
| ASSET QUALITY | ||||||||||||||||||||||||
| Nonperforming assets ("NPAs") | $ | 98,623 | $ | 93,498 | $ | 97,916 | $ | 83,959 | $ | 93,290 | 6 | |||||||||||||
| ACL, loans | 208,396 | 210,429 | 215,791 | 216,500 | 211,974 | (2 | ) | |||||||||||||||||
| ACL, total | 225,996 | 225,520 | 228,276 | 228,045 | 223,201 | 1 | ||||||||||||||||||
| Net charge-offs | 10,377 | 16,418 | 7,676 | 8,225 | 9,607 | 8 | ||||||||||||||||||
| ACL, loans to loans | 1.06 | % | 1.09 | % | 1.13 | % | 1.14 | % | 1.15 | % | ||||||||||||||
| ACL, total to loans | 1.15 | 1.16 | 1.19 | 1.21 | 1.21 | |||||||||||||||||||
| Net charge-offs to average loans (4) | 0.22 | 0.34 | 0.16 | 0.18 | 0.21 | |||||||||||||||||||
| NPAs to total assets | 0.35 | 0.33 | 0.35 | 0.30 | 0.33 | |||||||||||||||||||
| AT PERIOD END ($ in millions) | ||||||||||||||||||||||||
| Loans | $ | 19,602 | $ | 19,384 | $ | 19,175 | $ | 18,921 | $ | 18,425 | 6 | |||||||||||||
| Investment securities | 5,889 | 5,988 | 6,163 | 6,382 | 6,661 | (12 | ) | |||||||||||||||||
| Total assets | 28,177 | 28,003 | 28,143 | 28,086 | 27,874 | 1 | ||||||||||||||||||
| Deposits | 24,025 | 23,798 | 24,021 | 23,963 | 23,762 | 1 | ||||||||||||||||||
| Shareholders’ equity | 3,655 | 3,639 | 3,597 | 3,613 | 3,501 | 4 | ||||||||||||||||||
| Common shares outstanding (thousands) | 119,684 | 120,598 | 121,553 | 121,431 | 119,514 | — | ||||||||||||||||||
(1) Excludes non-operating items as detailed on Non-GAAP Performance Measures Reconciliation. (2) Net income less preferred stock dividends, divided by average common equity. (3) Excludes effect of acquisition related intangibles and associated amortization. (4) Annualized. (5) Excludes income tax expense and provision for credit losses.
3
UNITED COMMUNITY BANKS, INC.
Loan Portfolio Composition at Period-End
| 2026 | 2025 | Linked | Year over | |||||||||||||||||||||||||
| (in millions) | First Quarter | Fourth Quarter | Third Quarter | Second Quarter | First Quarter | Quarter Change | Year Change | |||||||||||||||||||||
| LOANS BY CATEGORY | ||||||||||||||||||||||||||||
| Owner occupied commercial RE | $ | 4,041 | $ | 3,950 | $ | 3,678 | $ | 3,563 | $ | 3,419 | $ | 91 | $ | 622 | ||||||||||||||
| Income producing commercial RE | 4,984 | 5,032 | 4,534 | 4,548 | 4,416 | (48 | ) | 568 | ||||||||||||||||||||
| Commercial & industrial | 2,771 | 2,696 | 2,593 | 2,516 | 2,506 | 75 | 265 | |||||||||||||||||||||
| Commercial construction & land | 1,072 | 998 | 1,734 | 1,752 | 1,681 | 74 | (609 | ) | ||||||||||||||||||||
| Equipment financing | 1,897 | 1,848 | 1,808 | 1,778 | 1,723 | 49 | 174 | |||||||||||||||||||||
| Total commercial | 14,765 | 14,524 | 14,347 | 14,157 | 13,745 | 241 | 1,020 | |||||||||||||||||||||
| Residential mortgage | 3,122 | 3,157 | 3,198 | 3,210 | 3,218 | (35 | ) | (96 | ) | |||||||||||||||||||
| Home equity | 1,344 | 1,319 | 1,252 | 1,180 | 1,099 | 25 | 245 | |||||||||||||||||||||
| Residential construction & land | 185 | 191 | 178 | 174 | 171 | (6 | ) | 14 | ||||||||||||||||||||
| Consumer | 187 | 188 | 192 | 191 | 183 | (1 | ) | 4 | ||||||||||||||||||||
| Other | (1 | ) | 5 | 8 | 9 | 9 | (6 | ) | (10 | ) | ||||||||||||||||||
| Total loans | $ | 19,602 | $ | 19,384 | $ | 19,175 | $ | 18,921 | $ | 18,425 | $ | 218 | $ | 1,177 | ||||||||||||||
| LOANS BY MARKET | ||||||||||||||||||||||||||||
| Georgia | $ | 4,617 | $ | 4,635 | $ | 4,584 | $ | 4,551 | $ | 4,484 | $ | (18 | ) | $ | 133 | |||||||||||||
| South Carolina | 3,037 | 2,971 | 2,926 | 2,872 | 2,821 | 66 | 216 | |||||||||||||||||||||
| North Carolina | 2,722 | 2,712 | 2,676 | 2,626 | 2,666 | 10 | 56 | |||||||||||||||||||||
| Tennessee | 1,895 | 1,913 | 1,902 | 1,881 | 1,880 | (18 | ) | 15 | ||||||||||||||||||||
| Florida | 3,229 | 3,102 | 3,040 | 2,966 | 2,572 | 127 | 657 | |||||||||||||||||||||
| Alabama | 1,049 | 1,050 | 1,054 | 1,016 | 1,009 | (1 | ) | 40 | ||||||||||||||||||||
| Commercial Banking Solutions | 3,053 | 3,001 | 2,993 | 3,009 | 2,993 | 52 | 60 | |||||||||||||||||||||
| Total loans | $ | 19,602 | $ | 19,384 | $ | 19,175 | $ | 18,921 | $ | 18,425 | $ | 218 | $ | 1,177 | ||||||||||||||
4
UNITED COMMUNITY BANKS, INC.
Credit Quality
(in thousands)
| 2026 | 2025 | |||||||||||||||||||||||
| First Quarter | Fourth Quarter | Third Quarter | ||||||||||||||||||||||
| NONACCRUAL LOANS | ||||||||||||||||||||||||
| Owner occupied RE | $ | 18,265 | $ | 11,165 | $ | 10,275 | ||||||||||||||||||
| Income producing RE | 11,037 | 11,488 | 10,884 | |||||||||||||||||||||
| Commercial & industrial | 19,890 | 18,294 | 25,754 | |||||||||||||||||||||
| Commercial construction & land | 17 | 18 | 3,198 | |||||||||||||||||||||
| Equipment financing | 8,024 | 10,383 | 9,716 | |||||||||||||||||||||
| Total commercial | 57,233 | 51,348 | 59,827 | |||||||||||||||||||||
| Residential mortgage | 31,906 | 32,423 | 28,978 | |||||||||||||||||||||
| Home equity | 6,209 | 5,247 | 5,234 | |||||||||||||||||||||
| Residential construction & land | 355 | 1,079 | 1,241 | |||||||||||||||||||||
| Consumer | 1,009 | 1,001 | 1,163 | |||||||||||||||||||||
| Total nonaccrual loans | 96,712 | 91,098 | 96,443 | |||||||||||||||||||||
| OREO and repossessed assets | 1,911 | 2,400 | 1,473 | |||||||||||||||||||||
| Total NPAs | $ | 98,623 | $ | 93,498 | $ | 97,916 | ||||||||||||||||||
| 2026 | 2025 | |||||||||||||||||||||||
| First Quarter | Fourth Quarter | Third Quarter | ||||||||||||||||||||||
| (in thousands) | Net Charge-Offs | Net Charge-Offs to Average Loans (1) | Net Charge-Offs | Net Charge-Offs to Average Loans (1) | Net Charge-Offs | Net Charge-Offs to Average Loans (1) | ||||||||||||||||||
| NET CHARGE-OFFS (RECOVERIES) BY CATEGORY | ||||||||||||||||||||||||
| Owner occupied RE | $ | 666 | 0.07 | % | $ | 1,610 | 0.17 | % | $ | 2,497 | 0.28 | % | ||||||||||||
| Income producing RE | (85 | ) | (0.01 | ) | (116 | ) | (0.01 | ) | (106 | ) | (0.01 | ) | ||||||||||||
| Commercial & industrial | 3,309 | 0.50 | 7,557 | 1.15 | (1,132 | ) | (0.18 | ) | ||||||||||||||||
| Commercial construction & land | 6 | — | 1,484 | 0.35 | 491 | 0.11 | ||||||||||||||||||
| Equipment financing | 5,835 | 1.29 | 5,092 | 1.12 | 5,487 | 1.23 | ||||||||||||||||||
| Total commercial | 9,731 | 0.27 | 15,627 | 0.43 | 7,237 | 0.20 | ||||||||||||||||||
| Residential mortgage | 133 | 0.02 | 126 | 0.02 | (259 | ) | (0.03 | ) | ||||||||||||||||
| Home equity | (54 | ) | (0.02 | ) | (94 | ) | (0.03 | ) | 19 | 0.01 | ||||||||||||||
| Residential construction & land | 12 | 0.03 | 16 | 0.03 | 12 | 0.03 | ||||||||||||||||||
| Consumer | 555 | 1.21 | 743 | 1.55 | 667 | 1.39 | ||||||||||||||||||
| Total | $ | 10,377 | 0.22 | $ | 16,418 | 0.34 | $ | 7,676 | 0.16 | |||||||||||||||
| (1) Annualized. | ||||||||||||||||||||||||
5
| UNITED COMMUNITY BANKS, INC. |
| Consolidated Balance Sheets (Unaudited) |
| (in thousands, except share and per share data) | March 31, 2026 |
December 31, 2025 | ||
| ASSETS | ||||
| Cash and due from banks | $ 177,025 | $ 202,586 | ||
| Interest-bearing deposits in banks | 316,116 | 193,168 | ||
| Cash and cash equivalents | 493,141 | 395,754 | ||
| Trading securities | 103,384 | — | ||
| Debt securities available-for-sale | 3,574,546 | 3,750,863 | ||
| Debt securities held-to-maturity (fair value $1,878,414 and $1,918,426, respectively) | 2,211,523 | 2,237,356 | ||
| Loans held for sale | 41,357 | 39,381 | ||
| Loans and leases held for investment | 19,601,641 | 19,384,317 | ||
| Less allowance for credit losses - loans and leases | (208,396) | (210,429) | ||
| Loans and leases, net | 19,393,245 | 19,173,888 | ||
| Premises and equipment, net | 391,883 | 393,714 | ||
| Bank-owned life insurance | 365,492 | 364,184 | ||
| Goodwill and other intangible assets, net | 964,819 | 967,882 | ||
| Other assets | 637,192 | 679,532 | ||
| Total assets | $ 28,176,582 | $ 28,002,554 | ||
| LIABILITIES AND SHAREHOLDERS' EQUITY | ||||
| Liabilities: | ||||
| Deposits: | ||||
| Noninterest-bearing demand | $ 6,473,101 | $ 6,252,252 | ||
| NOW and interest-bearing demand | 5,900,748 | 5,969,864 | ||
| Money market | 6,720,216 | 6,696,530 | ||
| Savings | 1,101,590 | 1,085,331 | ||
| Time | 3,664,706 | 3,619,189 | ||
| Brokered | 164,704 | 175,264 | ||
| Total deposits | 24,025,065 | 23,798,430 | ||
| Short-term borrowings | — | 85,000 | ||
| Long-term debt | 120,500 | 120,400 | ||
| Accrued expense and other liabilities | 376,351 | 360,038 | ||
| Total liabilities | 24,521,916 | 24,363,868 | ||
| Shareholders' equity: | ||||
| Common stock, $1 par value; 200,000,000 shares authorized, 119,684,031 and 120,598,266 shares issued and outstanding, respectively | 119,684 | 120,598 | ||
| Capital surplus | 2,721,132 | 2,754,399 | ||
| Retained earnings | 968,188 | 914,261 | ||
| Accumulated other comprehensive loss | (154,338) | (150,572) | ||
| Total shareholders' equity | 3,654,666 | 3,638,686 | ||
| Total liabilities and shareholders' equity | $ 28,176,582 | $ 28,002,554 |
6
| UNITED COMMUNITY BANKS, INC. |
| Consolidated Statements of Income (Unaudited) |
| Three Months Ended March 31, | ||||||||
| (in thousands, except per share data) | 2026 | 2025 | ||||||
| Interest revenue: | ||||||||
| Loans, including fees | $ | 286,599 | $ | 274,056 | ||||
| Investment securities, including tax exempt of $1,646 and $1,678, respectively | 45,344 | 58,850 | ||||||
| Trading securities | 785 | — | ||||||
| Deposits in banks and short-term investments | 1,233 | 2,451 | ||||||
| Total interest revenue | 333,961 | 335,357 | ||||||
| Interest expense: | ||||||||
| Deposits: | ||||||||
| NOW and interest-bearing demand | 28,129 | 37,390 | ||||||
| Money market | 40,709 | 49,541 | ||||||
| Savings | 480 | 624 | ||||||
| Time | 28,711 | 31,379 | ||||||
| Deposits | 98,029 | 118,934 | ||||||
| Short-term borrowings | 998 | 1,107 | ||||||
| Federal Home Loan Bank advances | 969 | 433 | ||||||
| Long-term debt | 1,201 | 2,862 | ||||||
| Total interest expense | 101,197 | 123,336 | ||||||
| Net interest revenue | 232,764 | 212,021 | ||||||
| Noninterest income: | ||||||||
| Service charges and fees | 9,545 | 9,535 | ||||||
| Mortgage loan gains and other related fees | 8,029 | 6,122 | ||||||
| Wealth management fees | 4,629 | 4,465 | ||||||
| Net gains from sales of other loans | 1,893 | 1,396 | ||||||
| Lending and loan servicing fees | 3,971 | 4,165 | ||||||
| Securities gains, net | 133 | 6 | ||||||
| Other | 15,546 | 9,967 | ||||||
| Total noninterest income | 43,746 | 35,656 | ||||||
| Total revenue | 276,510 | 247,677 | ||||||
| Provision for credit losses | 10,853 | 15,419 | ||||||
| Noninterest expense: | ||||||||
| Salaries and employee benefits | 101,249 | 84,267 | ||||||
| Communications and equipment | 14,102 | 13,699 | ||||||
| Occupancy | 11,725 | 10,929 | ||||||
| Advertising and public relations | 2,397 | 1,881 | ||||||
| Postage, printing and supplies | 2,757 | 2,561 | ||||||
| Professional fees | 5,576 | 5,931 | ||||||
| Lending and loan servicing expense | 2,582 | 1,987 | ||||||
| Outside services - electronic banking | 3,559 | 2,763 | ||||||
| FDIC assessments and other regulatory charges | 2,269 | 4,642 | ||||||
| Amortization of intangibles | 3,063 | 3,286 | ||||||
| Merger-related and other charges | 873 | 1,297 | ||||||
| Other | 7,150 | 7,856 | ||||||
| Total noninterest expense | 157,302 | 141,099 | ||||||
| Income before income taxes | 108,355 | 91,159 | ||||||
| Income tax expense | 24,066 | 19,746 | ||||||
| Net income | 84,289 | 71,413 | ||||||
| Preferred stock dividends | — | 1,573 | ||||||
| Earnings allocated to participating securities | 552 | 411 | ||||||
| Net income available to common shareholders | $ | 83,737 | $ | 69,429 | ||||
| Net income per common share: | ||||||||
| Basic | $ | 0.69 | $ | 0.58 | ||||
| Diluted | 0.69 | 0.58 | ||||||
| Weighted average common shares outstanding: | ||||||||
| Basic | 120,498 | 120,043 | ||||||
| Diluted | 120,723 | 120,201 | ||||||
7
| UNITED COMMUNITY BANKS, INC. |
| Average Consolidated Balance Sheets and Net Interest Analysis |
| For the Three Months Ended March 31, |
| 2026 | 2025 | |||||||||||||||||||||||
| (dollars in thousands, fully taxable equivalent (FTE)) | Average Balance | Interest | Average Rate | Average Balance | Interest | Average Rate | ||||||||||||||||||
| Assets: | ||||||||||||||||||||||||
| Interest-earning assets: | ||||||||||||||||||||||||
| Loans, net of unearned income (FTE) (1)(2) | $ | 19,403,795 | $ | 286,629 | 5.99 | % | $ | 18,213,501 | $ | 273,930 | 6.10 | % | ||||||||||||
| AFS & HTM taxable securities (3) | 5,845,672 | 43,698 | 2.99 | 6,737,658 | 57,172 | 3.39 | ||||||||||||||||||
| AFS & HTM tax-exempt securities (FTE) (1)(3) | 346,420 | 2,202 | 2.54 | 356,712 | 2,245 | 2.52 | ||||||||||||||||||
| Other interest-earning assets | 389,637 | 2,540 | 2.64 | 400,592 | 3,001 | 3.04 | ||||||||||||||||||
| Total interest-earning assets (FTE) | 25,985,524 | 335,069 | 5.22 | 25,708,463 | 336,348 | 5.29 | ||||||||||||||||||
| Noninterest-earning assets: | ||||||||||||||||||||||||
| Allowance for credit losses | (212,867 | ) | (210,169 | ) | ||||||||||||||||||||
| Cash and due from banks | 200,085 | 219,540 | ||||||||||||||||||||||
| Premises and equipment | 393,853 | 396,443 | ||||||||||||||||||||||
| Other assets (3) | 1,705,566 | 1,610,104 | ||||||||||||||||||||||
| Total assets | $ | 28,072,161 | $ | 27,724,381 | ||||||||||||||||||||
| Liabilities and Shareholders' Equity: | ||||||||||||||||||||||||
| Interest-bearing liabilities: | ||||||||||||||||||||||||
| Interest-bearing deposits: | ||||||||||||||||||||||||
| NOW and interest-bearing demand | $ | 5,853,104 | 28,129 | 1.95 | $ | 6,134,004 | 37,390 | 2.47 | ||||||||||||||||
| Money market | 6,826,707 | 40,709 | 2.42 | 6,583,963 | 49,541 | 3.05 | ||||||||||||||||||
| Savings | 1,089,856 | 480 | 0.18 | 1,096,308 | 624 | 0.23 | ||||||||||||||||||
| Time | 3,651,034 | 28,183 | 3.13 | 3,446,048 | 30,831 | 3.63 | ||||||||||||||||||
| Brokered time deposits | 60,279 | 528 | 3.55 | 50,447 | 548 | 4.41 | ||||||||||||||||||
| Total interest-bearing deposits | 17,480,980 | 98,029 | 2.27 | 17,310,770 | 118,934 | 2.79 | ||||||||||||||||||
| Federal funds purchased and other borrowings | 107,668 | 998 | 3.76 | 80,760 | 1,107 | 5.56 | ||||||||||||||||||
| Federal Home Loan Bank advances | 102,278 | 969 | 3.84 | 38,900 | 433 | 4.51 | ||||||||||||||||||
| Long-term debt | 120,450 | 1,201 | 4.04 | 254,220 | 2,862 | 4.57 | ||||||||||||||||||
| Total borrowed funds | 330,396 | 3,168 | 3.89 | 373,880 | 4,402 | 4.77 | ||||||||||||||||||
| Total interest-bearing liabilities | 17,811,376 | 101,197 | 2.30 | 17,684,650 | 123,336 | 2.83 | ||||||||||||||||||
| Noninterest-bearing liabilities: | ||||||||||||||||||||||||
| Noninterest-bearing deposits | 6,265,370 | 6,194,217 | ||||||||||||||||||||||
| Other liabilities | 337,611 | 369,939 | ||||||||||||||||||||||
| Total liabilities | 24,414,357 | 24,248,806 | ||||||||||||||||||||||
| Shareholders' equity | 3,657,804 | 3,475,575 | ||||||||||||||||||||||
| Total liabilities and shareholders' equity | $ | 28,072,161 | $ | 27,724,381 | ||||||||||||||||||||
| Net interest revenue (FTE) | $ | 233,872 | $ | 213,012 | ||||||||||||||||||||
| Net interest-rate spread (FTE) | 2.92 | % | 2.46 | % | ||||||||||||||||||||
| Net interest margin (FTE) (4) | 3.65 | % | 3.36 | % | ||||||||||||||||||||
| (1) | Interest revenue on tax-exempt securities and loans includes a taxable-equivalent adjustment to reflect comparable interest on taxable securities and loans. The FTE adjustment totaled $1.11 million and $991,000, respectively, for the three months ended March 31, 2026 and 2025. The tax rate used to calculate the adjustment was 25%, reflecting the statutory federal income tax rate and the federal tax adjusted state income tax rate. | |
| (2) | Included in the average balance of loans outstanding are loans on which the accrual of interest has been discontinued and loans that are held for sale. | |
| (3) | Unrealized gains and losses on AFS securities, including those related to the transfer from AFS to HTM, have been reclassified to other assets. Pretax unrealized losses of $176 million in 2026 and $269 million in 2025 are included in other assets for purposes of this presentation. | |
| (4) | Net interest margin is taxable equivalent net interest revenue divided by average interest-earning assets. |
8
| UNITED COMMUNITY BANKS, INC. | ||||||||||
| Non-GAAP Performance Measures Reconciliation | ||||||||||
| Selected Financial Information | ||||||||||
| (in thousands, except per share data) | ||||||||||
| 2026 | 2025 | |||||||||||||||||||
| First Quarter | Fourth Quarter | Third Quarter | Second Quarter | First Quarter | ||||||||||||||||
| Noninterest income reconciliation | ||||||||||||||||||||
| Noninterest income (GAAP) | $ | 43,746 | $ | 40,462 | $ | 43,219 | $ | 34,708 | $ | 35,656 | ||||||||||
| Gain on terminated cash flow hedge | (5,184 | ) | — | — | — | — | ||||||||||||||
| Noninterest income - operating | $ | 38,562 | $ | 40,462 | $ | 43,219 | $ | 34,708 | $ | 35,656 | ||||||||||
| Noninterest expense reconciliation | ||||||||||||||||||||
| Noninterest expense (GAAP) | $ | 157,302 | $ | 152,048 | $ | 150,868 | $ | 147,919 | $ | 141,099 | ||||||||||
| Payroll transition bonus | (6,704 | ) | — | — | — | — | ||||||||||||||
| FDIC special assessment accrual reversal | 1,885 | — | — | — | — | |||||||||||||||
| Merger-related and other charges | (873 | ) | (606 | ) | (3,468 | ) | (4,833 | ) | (1,297 | ) | ||||||||||
| Noninterest expense - operating | $ | 151,610 | $ | 151,442 | $ | 147,400 | $ | 143,086 | $ | 139,802 | ||||||||||
| Net income to operating income reconciliation | ||||||||||||||||||||
| Net income (GAAP) | $ | 84,289 | $ | 86,455 | $ | 91,494 | $ | 78,733 | $ | 71,413 | ||||||||||
| Gain on terminated cash flow hedge | (5,184 | ) | — | — | — | — | ||||||||||||||
| Payroll transition bonus | 6,704 | — | — | — | — | |||||||||||||||
| FDIC special assessment accrual reversal | (1,885 | ) | — | — | — | — | ||||||||||||||
| Merger-related and other charges | 873 | 606 | 3,468 | 4,833 | 1,297 | |||||||||||||||
| Income tax benefit of non-operating items | (113 | ) | (133 | ) | (751 | ) | (1,047 | ) | (281 | ) | ||||||||||
| Net income - operating | $ | 84,684 | $ | 86,928 | $ | 94,211 | $ | 82,519 | $ | 72,429 | ||||||||||
| Net income to pre-tax pre-provision income reconciliation | ||||||||||||||||||||
| Net income (GAAP) | $ | 84,289 | $ | 86,455 | $ | 91,494 | $ | 78,733 | $ | 71,413 | ||||||||||
| Income tax expense | 24,066 | 26,223 | 26,579 | 21,769 | 19,746 | |||||||||||||||
| Provision for credit losses | 10,853 | 13,662 | 7,907 | 11,818 | 15,419 | |||||||||||||||
| Pre-tax pre-provision income | $ | 119,208 | $ | 126,340 | $ | 125,980 | $ | 112,320 | $ | 106,578 | ||||||||||
| Diluted income per common share reconciliation | ||||||||||||||||||||
| Diluted income per common share (GAAP) | $ | 0.69 | $ | 0.70 | $ | 0.70 | $ | 0.63 | $ | 0.58 | ||||||||||
| Gain on terminated cash flow hedge | (0.03 | ) | — | — | — | — | ||||||||||||||
| Payroll transition bonus | 0.04 | — | — | — | — | |||||||||||||||
| FDIC special assessment accrual reversal | (0.01 | ) | — | — | — | — | ||||||||||||||
| Merger-related and other charges | 0.01 | 0.01 | 0.02 | 0.03 | 0.01 | |||||||||||||||
| Deemed dividend on preferred stock redemption | — | — | 0.03 | — | — | |||||||||||||||
| Diluted income per common share - operating | $ | 0.70 | $ | 0.71 | $ | 0.75 | $ | 0.66 | $ | 0.59 | ||||||||||
| Book value per common share reconciliation | ||||||||||||||||||||
| Book value per common share (GAAP) | $ | 30.54 | $ | 30.17 | $ | 29.44 | $ | 28.89 | $ | 28.42 | ||||||||||
| Effect of goodwill and other intangibles | (7.98 | ) | (7.93 | ) | (7.85 | ) | (7.89 | ) | (7.84 | ) | ||||||||||
| Tangible book value per common share | $ | 22.56 | $ | 22.24 | $ | 21.59 | $ | 21.00 | $ | 20.58 | ||||||||||
| Return on tangible common equity reconciliation | ||||||||||||||||||||
| Return on common equity (GAAP) | 9.35 | % | 9.48 | % | 9.20 | % | 8.45 | % | 7.89 | % | ||||||||||
| Gain on terminated cash flow hedge | (0.45 | ) | — | — | — | — | ||||||||||||||
| Payroll transition bonus | 0.58 | — | — | — | — | |||||||||||||||
| FDIC special assessment accrual reversal | (0.16 | ) | — | — | — | — | ||||||||||||||
| Merger-related and other charges | 0.07 | 0.05 | 0.29 | 0.42 | 0.12 | |||||||||||||||
| Deemed dividend on preferred stock redemption | — | — | 0.34 | — | — | |||||||||||||||
| Return on common equity - operating | 9.39 | 9.53 | 9.83 | 8.87 | 8.01 | |||||||||||||||
| Effect of goodwill and other intangibles | 3.66 | 3.78 | 3.73 | 3.47 | 3.20 | |||||||||||||||
| Return on tangible common equity - operating | 13.05 | % | 13.31 | % | 13.56 | % | 12.34 | % | 11.21 | % | ||||||||||
| Return on assets reconciliation | ||||||||||||||||||||
| Return on assets (GAAP) | 1.22 | % | 1.21 | % | 1.29 | % | 1.11 | % | 1.02 | % | ||||||||||
| Gain on terminated cash flow hedge | (0.06 | ) | — | — | — | — | ||||||||||||||
| Payroll transition bonus | 0.07 | — | — | — | — | |||||||||||||||
| FDIC special assessment accrual reversal | (0.02 | ) | — | — | — | — | ||||||||||||||
| Merger-related and other charges | 0.01 | 0.01 | 0.04 | 0.05 | 0.02 | |||||||||||||||
| Return on assets - operating | 1.22 | % | 1.22 | % | 1.33 | % | 1.16 | % | 1.04 | % | ||||||||||
9
| UNITED COMMUNITY BANKS, INC. | ||||||||||
| Non-GAAP Performance Measures Reconciliation | ||||||||||
| Selected Financial Information | ||||||||||
| (in thousands, except per share data) | ||||||||||
| 2026 | 2025 | |||||||||||||||||||
| First Quarter | Fourth Quarter | Third Quarter | Second Quarter | First Quarter | ||||||||||||||||
| Return on assets to return on assets- pre-tax pre-provision reconciliation | ||||||||||||||||||||
| Return on assets (GAAP) | 1.22 | % | 1.21 | % | 1.29 | % | 1.11 | % | 1.02 | % | ||||||||||
| Income tax expense | 0.35 | 0.37 | 0.38 | 0.31 | 0.29 | |||||||||||||||
| Provision for credit losses | 0.16 | 0.19 | 0.11 | 0.17 | 0.23 | |||||||||||||||
| Gain on terminated cash flow hedge | (0.08 | ) | — | — | — | — | ||||||||||||||
| Payroll transition bonus | 0.10 | — | — | — | — | |||||||||||||||
| FDIC special assessment accrual reversal | (0.03 | ) | — | — | — | — | ||||||||||||||
| Merger-related and other charges | 0.01 | 0.01 | 0.05 | 0.07 | 0.01 | |||||||||||||||
| Return on assets - pre-tax pre-provision - operating | 1.73 | % | 1.78 | % | 1.83 | % | 1.66 | % | 1.55 | % | ||||||||||
| Efficiency ratio reconciliation | ||||||||||||||||||||
| Efficiency ratio (GAAP) | 56.66 | % | 54.40 | % | 54.30 | % | 56.69 | % | 56.74 | % | ||||||||||
| Gain on terminated cash flow hedge | 1.03 | — | — | — | — | |||||||||||||||
| Payroll transition bonus | (2.41 | ) | — | — | — | — | ||||||||||||||
| FDIC special assessment accrual reversal | 0.68 | — | — | — | — | |||||||||||||||
| Merger-related and other charges | (0.31 | ) | (0.21 | ) | (1.25 | ) | (1.85 | ) | (0.52 | ) | ||||||||||
| Efficiency ratio - operating | 55.65 | % | 54.19 | % | 53.05 | % | 54.84 | % | 56.22 | % | ||||||||||
| Tangible common equity to tangible assets reconciliation | ||||||||||||||||||||
| Equity to total assets (GAAP) | 12.97 | % | 12.99 | % | 12.78 | % | 12.86 | % | 12.56 | % | ||||||||||
| Effect of goodwill and other intangibles | (3.05 | ) | (3.07 | ) | (3.07 | ) | (3.10 | ) | (3.06 | ) | ||||||||||
| Effect of preferred equity | — | — | — | (0.31 | ) | (0.32 | ) | |||||||||||||
| Tangible common equity to tangible assets | 9.92 | % | 9.92 | % | 9.71 | % | 9.45 | % | 9.18 | % | ||||||||||
10
About United Community Banks, Inc.
United Community Banks, Inc. (NYSE: UCB) is the financial holding company for United Community, a top-100 U.S. financial institution committed to building stronger communities and improving the financial health and well-being of its customers. United Community offers a full range of banking, mortgage and wealth management services. As of March 31, 2026, United Community Banks, Inc. had $28.2 billion in assets and operated 200 offices across Alabama, Florida, Georgia, North Carolina, South Carolina and Tennessee. The company also manages a nationally recognized SBA lending franchise and an equipment finance subsidiary, extending its reach to businesses across the country. United Community is the most awarded bank in the Southeast for Retail Banking Customer Satisfaction by J.D. Power, earning more awards than any other bank in the region, including recognition in 12 of the last 17 years. The company has also been named one of the “Best Banks to Work For” by American Banker for nine consecutive years. In commercial banking, United Community earned multiple 2026 Greenwich Best Bank awards for Small Business Banking. Forbes has consistently named United Community among the World’s Best and America’s Best Banks. Learn more at ucbi.com.
Non-GAAP Financial Measures
This press release, including the accompanying financial statement tables, contains financial information determined by methods other than in accordance with generally accepted accounting principles, or GAAP. This financial information includes certain operating performance measures, which exclude merger-related and other charges that are not considered part of recurring operations, such as “noninterest income – operating”, “noninterest expense - operating”, “operating net income,” “pre-tax, pre-provision income,” “operating net income per diluted common share,” “operating earnings per share,” “tangible book value per common share,” “operating return on common equity,” “operating return on tangible common equity,” “operating return on assets,” “return on assets - pre-tax, pre-provision - operating,” “return on assets - pre-tax, pre-provision,” “operating efficiency ratio,” and “tangible common equity to tangible assets.” These non-GAAP measures are included because United believes they may provide useful supplemental information for evaluating United’s underlying performance trends. These measures should be viewed in addition to, and not as an alternative to or substitute for, measures determined in accordance with GAAP, and are not necessarily comparable to non-GAAP measures that may be presented by other companies. To the extent applicable, reconciliations of these non-GAAP measures to the most directly comparable measures as reported in accordance with GAAP are included with the accompanying financial statement tables.
Caution About Forward-Looking Statements
This press release contains “forward-looking statements” within the meaning of Section 27A of the Securities Act of 1933, as amended, and Section 21E of the Securities Exchange Act of 1934, as amended. In general, forward-looking statements usually may be identified through use of words such as “may,” “believe,” “expect,” “anticipate,” “intend,” “will,” “should,” “plan,” “estimate,” “predict,” “continue” and “potential” or the negative of these terms or other comparable terminology. Forward-looking statements are not historical facts and represent management’s beliefs, based upon information available at the time the statements are made, with regard to the matters addressed; they are not guarantees of future performance. Actual results may prove to be materially different from the results expressed or implied by the forward-looking statements. Forward-looking statements are subject to numerous assumptions, risks and uncertainties that change over time and could cause actual results or financial condition to differ materially from those expressed in or implied by such statements.
11
Factors that could cause or contribute to such differences include, but are not limited to (1) the risk that the cost savings and any revenue synergies from the merger with Peach State Bancshares, Inc. (the “Merger”) may not be realized or take longer than anticipated to be realized, (2) disruption from the Merger of customer, supplier, employee or other business partner relationships, (3) the occurrence of any event, change or other circumstances that could give rise to the termination of the Merger Agreement, (4) the failure to obtain the necessary approval by the shareholders of Peach State, (5) the possibility that the costs, fees, expenses and charges related to the Merger may be greater than anticipated, (6) the ability of United to obtain required governmental approvals of the Merger on the anticipated timeframe and without the imposition of adverse conditions, (7) reputational risk and the reaction of each of the companies’ customers, suppliers, employees or other business partners to the Merger, (8) the failure of the closing conditions in the Merger Agreement to be satisfied, or any unexpected delay in closing the Merger, (9) the risks relating to the integration of Peach State’s operations into the operations of United, including the risk that such integration will be materially delayed or will be more costly or difficult than expected, (10) the risk of potential litigation or regulatory action related to the Merger, (11) the risks associated with United’s pursuit of future acquisitions, (12) the risk of expansion into new geographic or product markets, (13) the dilution caused by United’s issuance of additional shares of its common stock in the Merger, and (14) general competitive, economic, political and market conditions. Further information regarding additional factors which could affect the forward-looking statements can be found in the cautionary language included under the headings “Cautionary Note Regarding Forward-Looking Statements” and “Risk Factors” in United’s Annual Report on Form 10-K for the year ended December 31, 2025, and other documents subsequently filed by United with the U.S. Securities and Exchange Commission (“SEC”).
Many of these factors are beyond United’s ability to control or predict. If one or more events related to these or other risks or uncertainties materialize, or if the underlying assumptions prove to be incorrect, actual results may differ materially from the forward-looking statements. Accordingly, shareholders and investors should not place undue reliance on any such forward-looking statements. Any forward-looking statement speaks only as of the date of this communication, and United undertakes no obligation to update or revise any forward-looking statements, whether as a result of new information, future events or otherwise, except as required by law. New risks and uncertainties may emerge from time to time, and it is not possible for United to predict their occurrence or how they will affect United.
United qualifies all forward-looking statements by these cautionary statements.
# # #
12
| © 2026 United Community Bank | ucbi.com 1Q26 Investor Presentation April 21, 2026 |
| Disclosures 2 CAUTIONARY STATEMENT This Investor Presentation contains “forward-looking statements” within the meaning of Section 27A of the Securities Act of 1933, as amended, and Section 21E of the Securities Exchange Act of 1934, as amended. In general, forward-looking statements usually may be identified through use of words such as “may,” “believe,” “expect,” “anticipate,” “intend,” “will,” “should,” “plan,” “estimate,” “predict,” “continue” and “potential,” or the negative of these terms or other comparable terminology. Forward-looking statements are not historical facts and represent management’s beliefs, based upon information available at the time the statements are made, with regard to the matters addressed; they are not guarantees of future performance. Actual results may prove to be materially different from the results expressed or implied by the forward-looking statements. Forward-looking statements are subject to numerous assumptions, risks and uncertainties that change over time and could cause actual results or financial condition to differ materially from those expressed in or implied by such statements. Factors that could cause or contribute to such differences include, but are not limited to general competitive, economic, political, regulatory and market conditions. Further information regarding additional factors which could affect the forward-looking statements contained in this Investor Presentation can be found in the cautionary language included under the headings “Cautionary Note Regarding Forward-Looking Statements” and “Risk Factors” in United’s Annual Report on Form 10-K for the year ended December 31, 2025, and other documents subsequently filed by United with the United States Securities and Exchange Commission (“SEC”). Many of these factors are beyond United’s ability to control or predict. If one or more events related to these or other risks or uncertainties materialize, or if the underlying assumptions prove to be incorrect, actual results may differ materially from the forward-looking statements. Accordingly, shareholders and investors should not place undue reliance on any such forward-looking statements. Any forward-looking statement speaks only as of the date of this communication, and United undertakes no obligation to update or revise any forward-looking statements, whether as a result of new information, future events or otherwise, except as required by law. New risks and uncertainties may emerge from time to time, and it is not possible for United to predict their occurrence or how they will affect United. United qualifies all forward-looking statements by these cautionary statements. NON-GAAP MEASURES This Investor Presentation includes financial information determined by methods other than in accordance with generally accepted accounting principles (“GAAP”). This financial information includes certain operating performance measures, which exclude merger-related and other charges that are not considered part of recurring operations, such as "noninterest income – operating", “noninterest expense – operating,” “operating net income,” “pre-tax, pre-provision income,” “operating net income per diluted common share,” “operating earnings per share,” “tangible book value per common share,” “operating return on common equity,” “operating return on tangible common equity,” “operating return on assets,” “return on assets - pre-tax pre-provision - operating,” “return on assets - pre-tax, pre-provision,” “operating efficiency ratio,” and “tangible common equity to tangible assets.” These non-GAAP measures are included because United believes they may provide useful supplemental information for evaluating United’s underlying performance trends. Further, United’s management uses these measures in managing and evaluating United’s business and intends to refer to them in discussions about United’s operations and performance. These measures should be viewed in addition to, and not as an alternative to or substitute for, measures determined in accordance with GAAP, and are not necessarily comparable to non-GAAP measures that may be presented by other companies. To the extent applicable, reconciliations of these non-GAAP measures to the most directly comparable measures as reported in accordance with GAAP are included with the accompanying financial statement tables. |
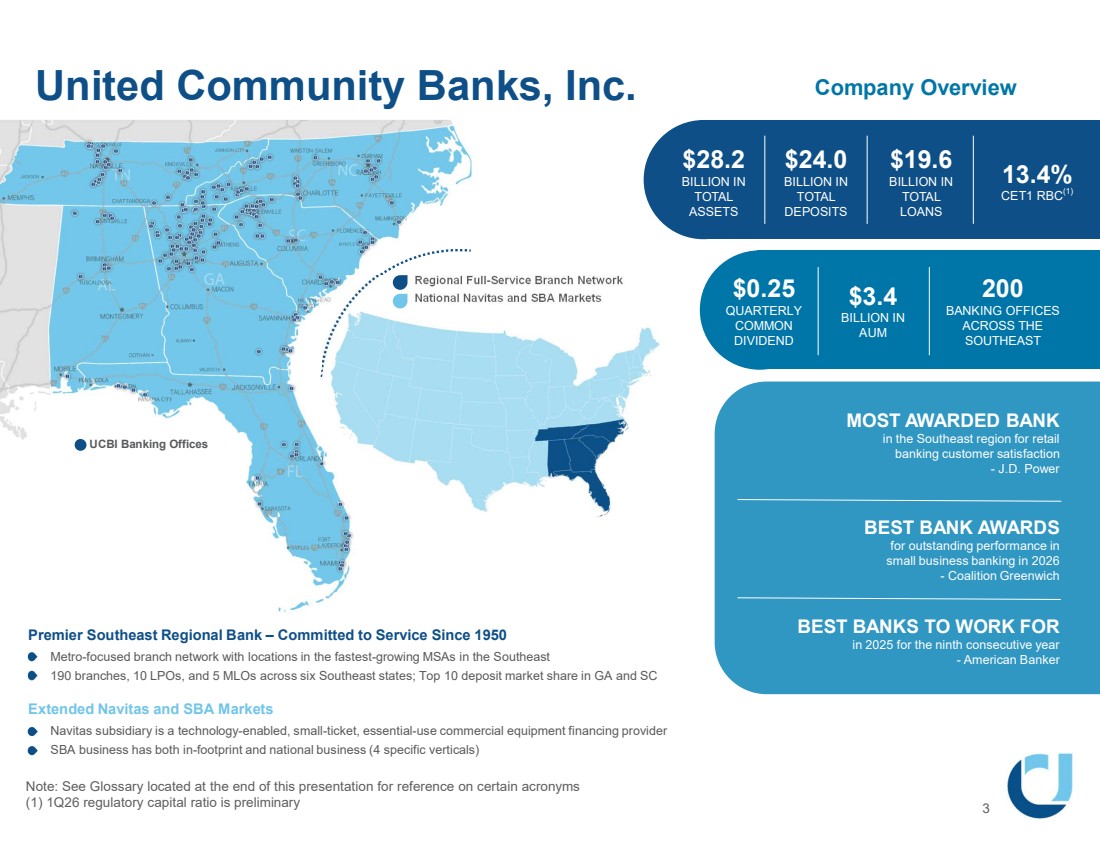
| $28.2 BILLION IN TOTAL ASSETS United Community Banks, Inc. Note: See Glossary located at the end of this presentation for reference on certain acronyms (1) 1Q26 regulatory capital ratio is preliminary 3 UCBI Banking Offices Regional Full-Service Branch Network National Navitas and SBA Markets Company Overview $24.0 BILLION IN TOTAL DEPOSITS $3.4 BILLION IN AUM 13.4% CET1 RBC(1) $19.6 BILLION IN TOTAL LOANS $0.25 QUARTERLY COMMON DIVIDEND 200 BANKING OFFICES ACROSS THE SOUTHEAST MOST AWARDED BANK in the Southeast region for retail banking customer satisfaction - J.D. Power BEST BANK AWARDS for outstanding performance in small business banking in 2026 - Coalition Greenwich BEST BANKS TO WORK FOR in 2025 for the ninth consecutive year - American Banker Premier Southeast Regional Bank – Committed to Service Since 1950 Metro-focused branch network with locations in the fastest-growing MSAs in the Southeast 190 branches, 10 LPOs, and 5 MLOs across six Southeast states; Top 10 deposit market share in GA and SC Extended Navitas and SBA Markets Navitas subsidiary is a technology-enabled, small-ticket, essential-use commercial equipment financing provider SBA business has both in-footprint and national business (4 specific verticals) |
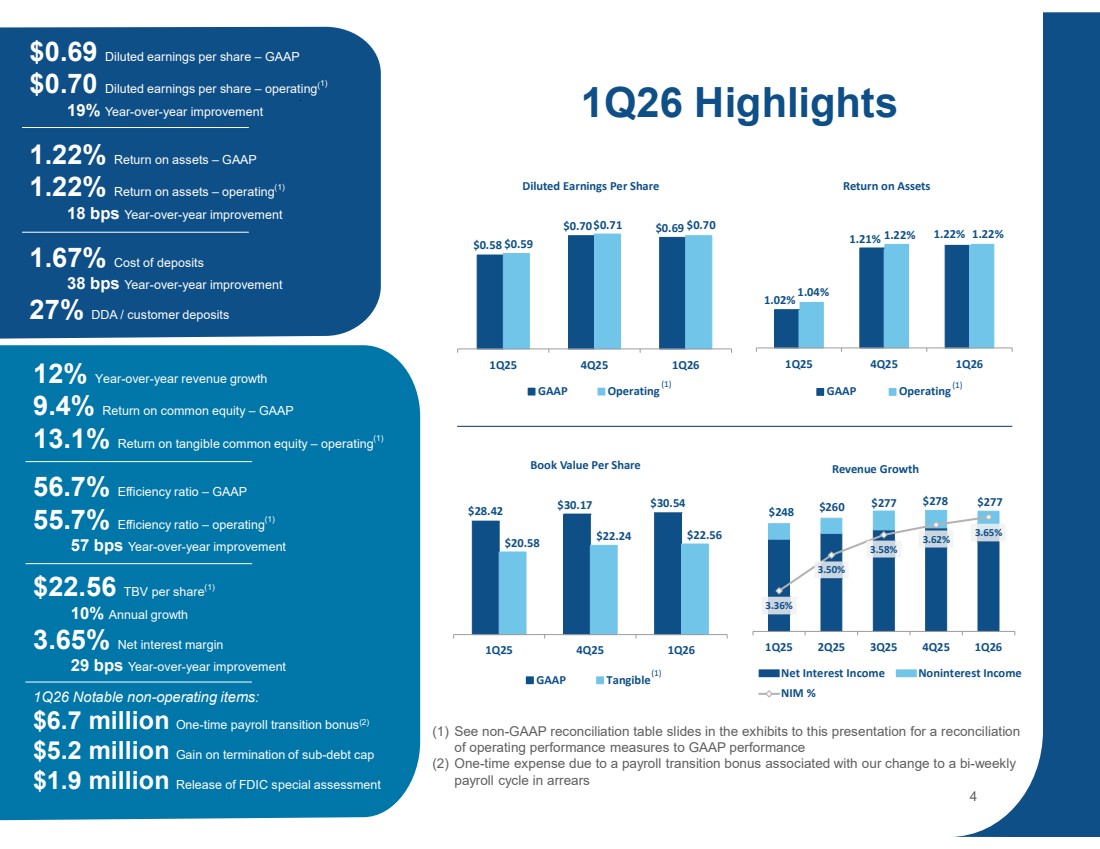
| 1.02% 1.21% 1.22% 1.04% 1.22% 1.22% 1Q25 4Q25 1Q26 Return on Assets GAAP Operating $0.58 $0.70 $0.69 $0.59 $0.71 $0.70 1Q25 4Q25 1Q26 Diluted Earnings Per Share GAAP Operating $28.42 $30.17 $30.54 $20.58 $22.24 $22.56 1Q25 4Q25 1Q26 Book Value Per Share GAAP Tangible 1.01% Return on assets – operating(1) 1Q26 Highlights (1) See non-GAAP reconciliation table slides in the exhibits to this presentation for a reconciliation of operating performance measures to GAAP performance (2) One-time expense due to a payroll transition bonus associated with our change to a bi-weekly payroll cycle in arrears $248 $260 $277 $278 $277 3.36% 3.50% 3.58% 3.62% 3.65% 1Q25 2Q25 3Q25 4Q25 1Q26 Revenue Growth Net Interest Income Noninterest Income NIM % 4 (1) (1) $0.69 Diluted earnings per share – GAAP $0.70 Diluted earnings per share – operating(1) 19% Year-over-year improvement 1.22% Return on assets – GAAP 1.22% Return on assets – operating(1) 18 bps Year-over-year improvement 1.67% Cost of deposits 38 bps Year-over-year improvement 27% DDA / customer deposits 12% Year-over-year revenue growth 9.4% Return on common equity – GAAP 13.1% Return on tangible common equity – operating(1) 56.7% Efficiency ratio – GAAP 55.7% Efficiency ratio – operating(1) 57 bps Year-over-year improvement $22.56 TBV per share(1) 10% Annual growth 3.65% Net interest margin 29 bps Year-over-year improvement (1) 1Q26 Notable non-operating items: $6.7 million One-time payroll transition bonus(2) $5.2 million Gain on termination of sub-debt cap $1.9 million Release of FDIC special assessment |
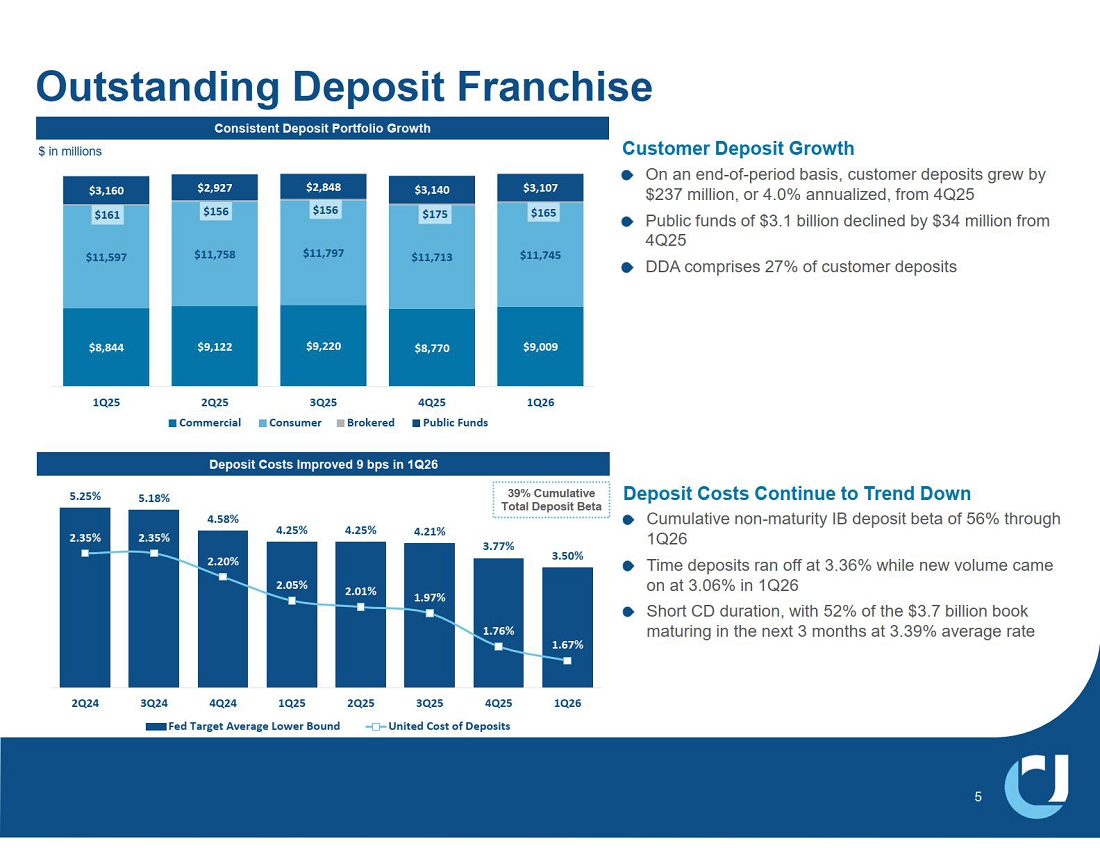
| 8,844 9,122 9,220 8,770 9,009 11,597 11,758 11,797 11,713 11,745 161 156 156 175 165 3,160 2,927 2,848 3,140 3,107 1Q25 2Q25 3Q25 4Q25 1Q26 Commercial Consumer Brokered Public Funds 5.25% 5.18% 4.58% 4.25% 4.25% 4.21% 3.77% 3.50% 2.35% 2.35% 2.20% 2.05% 2.01% 1.97% 1.76% 1.67% 2Q24 3Q24 4Q24 1Q25 2Q25 3Q25 4Q25 1Q26 Fed Target Average Lower Bound United Cost of Deposits Outstanding Deposit Franchise Deposit Costs Improved 9 bps in 1Q26 5 Customer Deposit Growth On an end-of-period basis, customer deposits grew by $237 million, or 4.0% annualized, from 4Q25 Public funds of $3.1 billion declined by $34 million from 4Q25 DDA comprises 27% of customer deposits Consistent Deposit Portfolio Growth $ in millions Deposit Costs Continue to Trend Down Cumulative non-maturity IB deposit beta of 56% through 1Q26 Time deposits ran off at 3.36% while new volume came on at 3.06% in 1Q26 Short CD duration, with 52% of the $3.7 billion book maturing in the next 3 months at 3.39% average rate 39% Cumulative Total Deposit Beta |
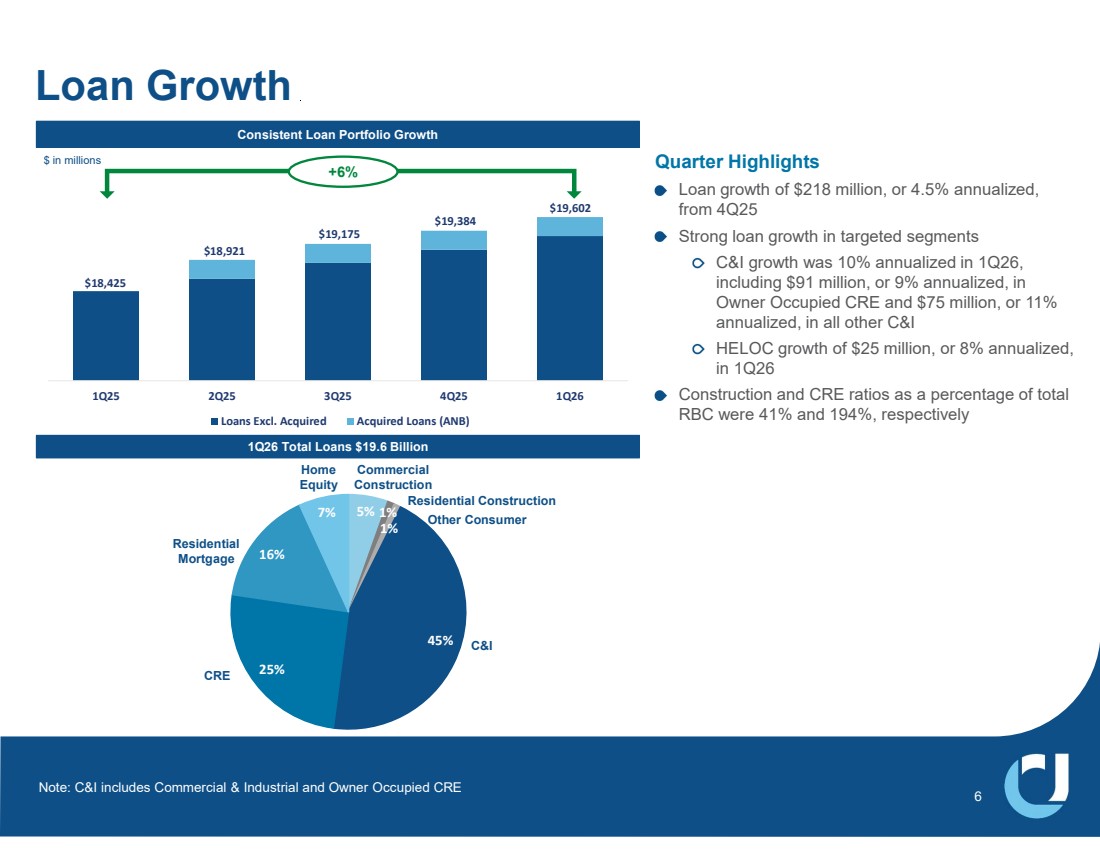
| $18,425 $18,921 $19,175 $19,384 $19,602 1Q25 2Q25 3Q25 4Q25 1Q26 Loans Excl. Acquired Acquired Loans (ANB) Consistent Loan Portfolio Growth Loan Growth Quarter Highlights Loan growth of $218 million, or 4.5% annualized, from 4Q25 Strong loan growth in targeted segments C&I growth was 10% annualized in 1Q26, including $91 million, or 9% annualized, in Owner Occupied CRE and $75 million, or 11% annualized, in all other C&I HELOC growth of $25 million, or 8% annualized, in 1Q26 Construction and CRE ratios as a percentage of total RBC were 41% and 194%, respectively 6 1Q26 Total Loans $19.6 Billion 5% 1% 1% 45% 25% 16% 7% C&I Commercial Construction CRE Other Consumer Residential Mortgage Home Equity Residential Construction $ in millions Note: C&I includes Commercial & Industrial and Owner Occupied CRE +6% |
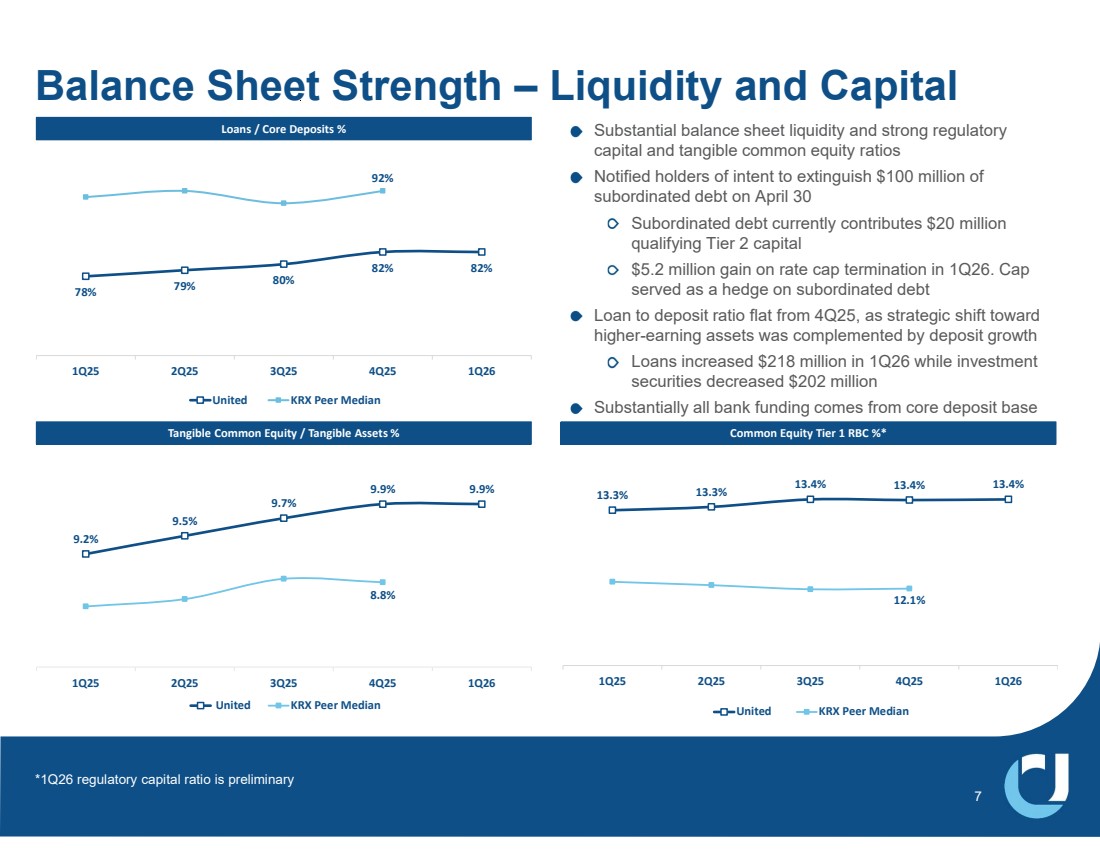
| 78% 79% 80% 82% 82% 92% 1Q25 2Q25 3Q25 4Q25 1Q26 United KRX Peer Median Substantial balance sheet liquidity and strong regulatory capital and tangible common equity ratios Notified holders of intent to extinguish $100 million of subordinated debt on April 30 Subordinated debt currently contributes $20 million qualifying Tier 2 capital $5.2 million gain on rate cap termination in 1Q26. Cap served as a hedge on subordinated debt Loan to deposit ratio flat from 4Q25, as strategic shift toward higher-earning assets was complemented by deposit growth Loans increased $218 million in 1Q26 while investment securities decreased $202 million Substantially all bank funding comes from core deposit base 9.2% 9.5% 9.7% 9.9% 9.9% 8.8% 1Q25 2Q25 3Q25 4Q25 1Q26 United KRX Peer Median Loans / Core Deposits % Tangible Common Equity / Tangible Assets % Common Equity Tier 1 RBC %* 13.3% 13.3% 13.4% 13.4% 13.4% 12.1% 1Q25 2Q25 3Q25 4Q25 1Q26 United KRX Peer Median Balance Sheet Strength – Liquidity and Capital 7 *1Q26 regulatory capital ratio is preliminary |
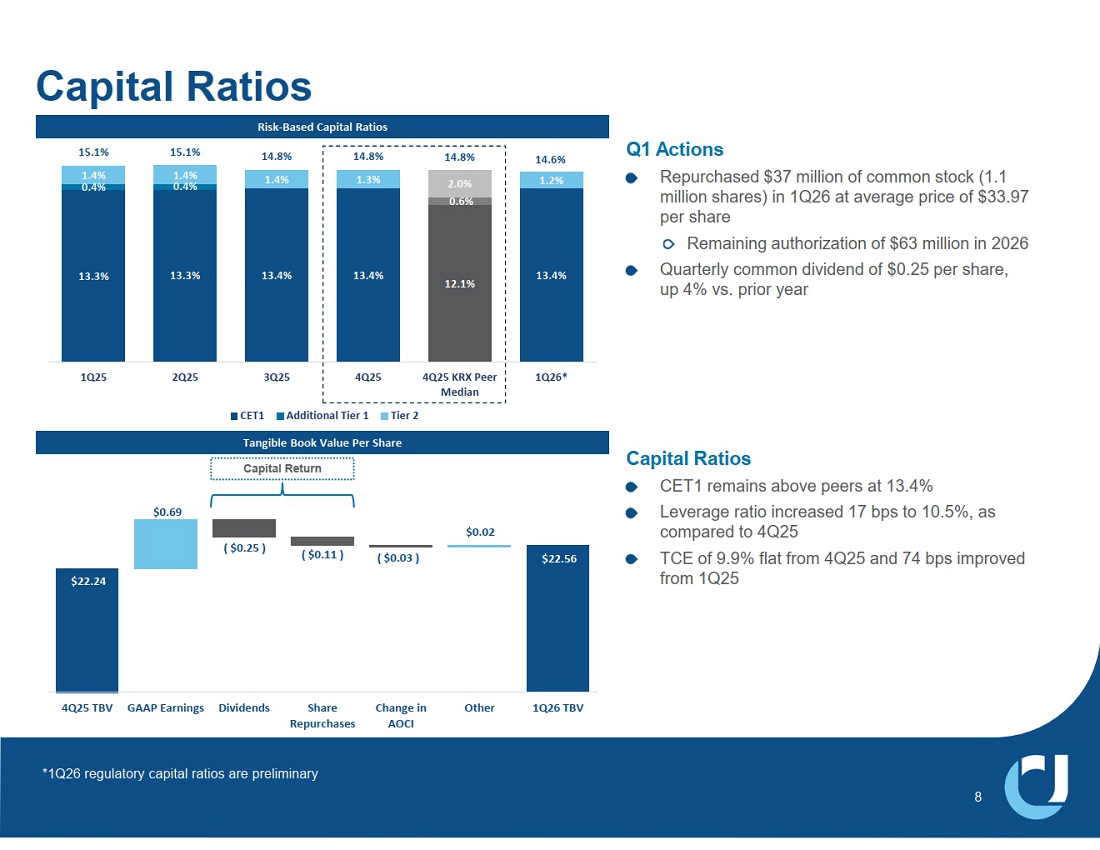
| 8 Risk-Based Capital Ratios Tangible Book Value Per Share Q1 Actions Repurchased $37 million of common stock (1.1 million shares) in 1Q26 at average price of $33.97 per share Remaining authorization of $63 million in 2026 Quarterly common dividend of $0.25 per share, up 4% vs. prior year Capital Ratios CET1 remains above peers at 13.4% Leverage ratio increased 17 bps to 10.5%, as compared to 4Q25 TCE of 9.9% flat from 4Q25 and 74 bps improved from 1Q25 13.3% 13.3% 13.4% 13.4% 12.1% 13.4% 0.4% 0.4% 0.6% 1.4% 1.4% 1.4% 1.3% 2.0% 1.2% 15.1% 15.1% 14.8% 14.8% 14.8% 14.6% 1Q25 2Q25 3Q25 4Q25 4Q25 KRX Peer Median 1Q26* CET1 Additional Tier 1 Tier 2 Capital Ratios $22.56 $22.24 $0.69 ( $0.25 ) ( $0.11 ) ( $0.03 ) $0.02 4Q25 TBV GAAP Earnings Dividends Share Repurchases Change in AOCI Other 1Q26 TBV *1Q26 regulatory capital ratios are preliminary Deployment |
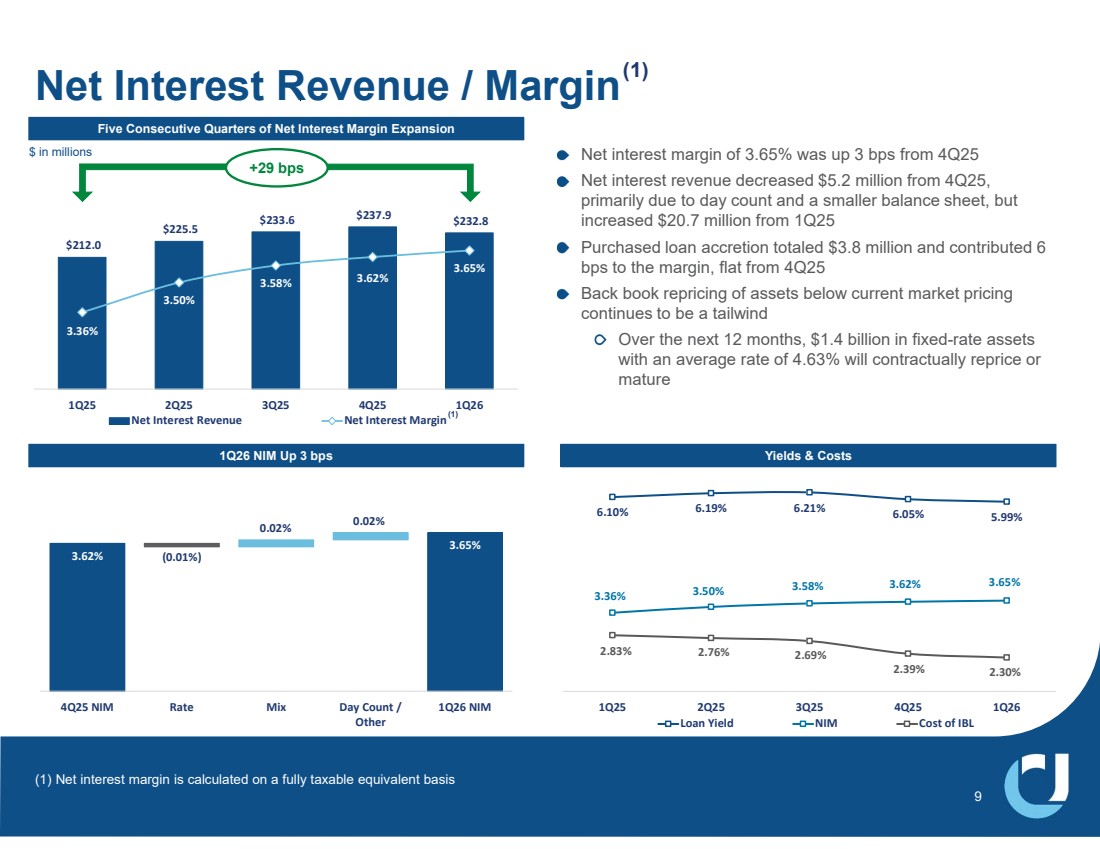
| $212.0 $225.5 $233.6 $237.9 $232.8 3.36% 3.50% 3.58% 3.62% 3.65% $ 100.0 $ 120.0 $ 140.0 $ 160.0 $ 180.0 $ 200.0 $ 220.0 $ 240.0 3.00% 3.10% 3.20% 3.30% 3.40% 3.50% 3.60% 3.70% 3.80% 1Q25 2Q25 3Q25 4Q25 1Q26 Net Interest Revenue Net Interest Margin 3.65% 3.62% (0.01%) 0.02% 0.02% 4Q25 NIM Rate Mix Day Count / Other 1Q26 NIM Five Consecutive Quarters of Net Interest Margin Expansion 1Q26 NIM Up 3 bps Net interest margin of 3.65% was up 3 bps from 4Q25 Net interest revenue decreased $5.2 million from 4Q25, primarily due to day count and a smaller balance sheet, but increased $20.7 million from 1Q25 Purchased loan accretion totaled $3.8 million and contributed 6 bps to the margin, flat from 4Q25 Back book repricing of assets below current market pricing continues to be a tailwind Over the next 12 months, $1.4 billion in fixed-rate assets with an average rate of 4.63% will contractually reprice or mature Net Interest Revenue / Margin (1) Yields & Costs 6.10% 6.19% 6.21% 6.05% 5.99% 3.36% 3.50% 3.58% 3.62% 3.65% 2.83% 2.76% 2.69% 2.39% 2.30% 1Q25 2Q25 3Q25 4Q25 1Q26 Loan Yield NIM Cost of IBL (1) Net interest margin is calculated on a fully taxable equivalent basis (1) 9 $ in millions +29 bps |
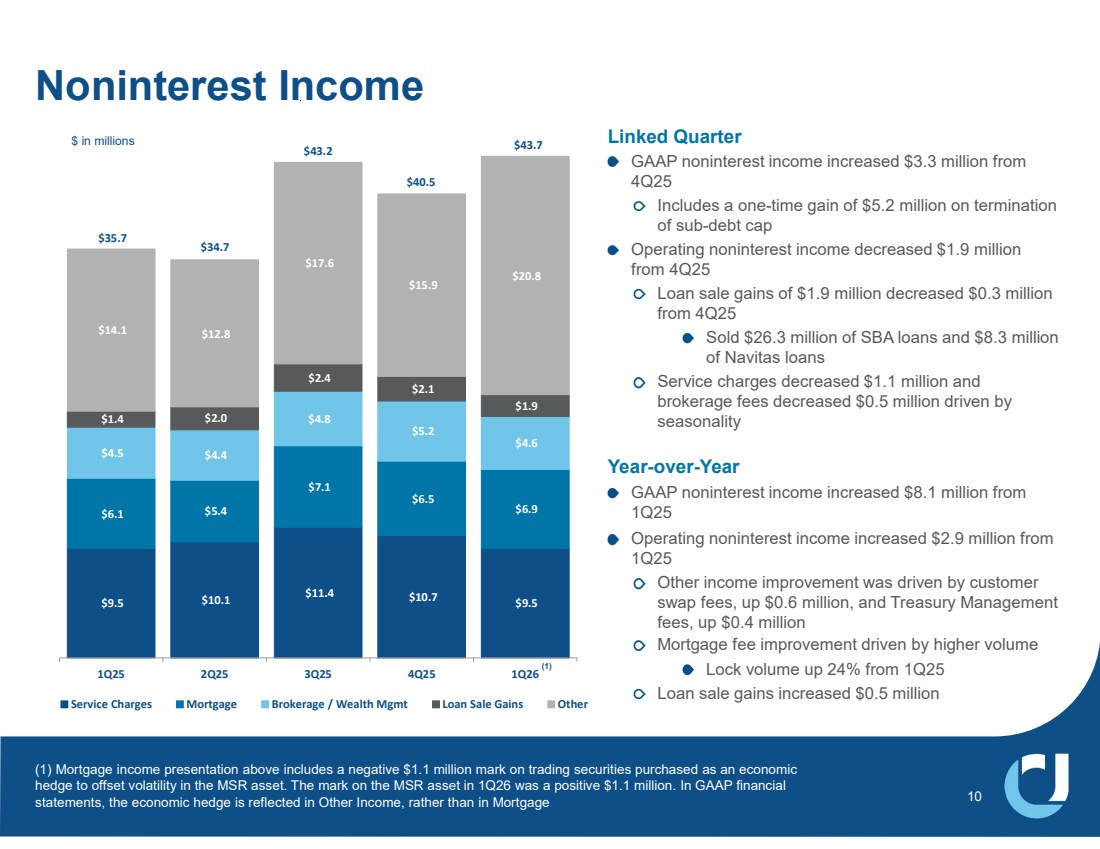
| $9.5 $10.1 $11.4 $10.7 $9.5 $6.1 $5.4 $7.1 $6.5 $6.9 $4.5 $4.4 $4.8 $5.2 $4.6 $1.4 $2.0 $2.4 $2.1 $1.9 $14.1 $12.8 $17.6 $15.9 $20.8 1Q25 2Q25 3Q25 4Q25 1Q26 Service Charges Mortgage Brokerage / Wealth Mgmt Loan Sale Gains Other Linked Quarter GAAP noninterest income increased $3.3 million from 4Q25 Includes a one-time gain of $5.2 million on termination of sub-debt cap Operating noninterest income decreased $1.9 million from 4Q25 Loan sale gains of $1.9 million decreased $0.3 million from 4Q25 Sold $26.3 million of SBA loans and $8.3 million of Navitas loans Service charges decreased $1.1 million and brokerage fees decreased $0.5 million driven by seasonality Year-over-Year GAAP noninterest income increased $8.1 million from 1Q25 Operating noninterest income increased $2.9 million from 1Q25 Other income improvement was driven by customer swap fees, up $0.6 million, and Treasury Management fees, up $0.4 million Mortgage fee improvement driven by higher volume Lock volume up 24% from 1Q25 Loan sale gains increased $0.5 million 10 Noninterest Income $35.7 $ in millions $34.7 $43.2 $40.5 $43.7 (1) Mortgage income presentation above includes a negative $1.1 million mark on trading securities purchased as an economic hedge to offset volatility in the MSR asset. The mark on the MSR asset in 1Q26 was a positive $1.1 million. In GAAP financial statements, the economic hedge is reflected in Other Income, rather than in Mortgage (1) |
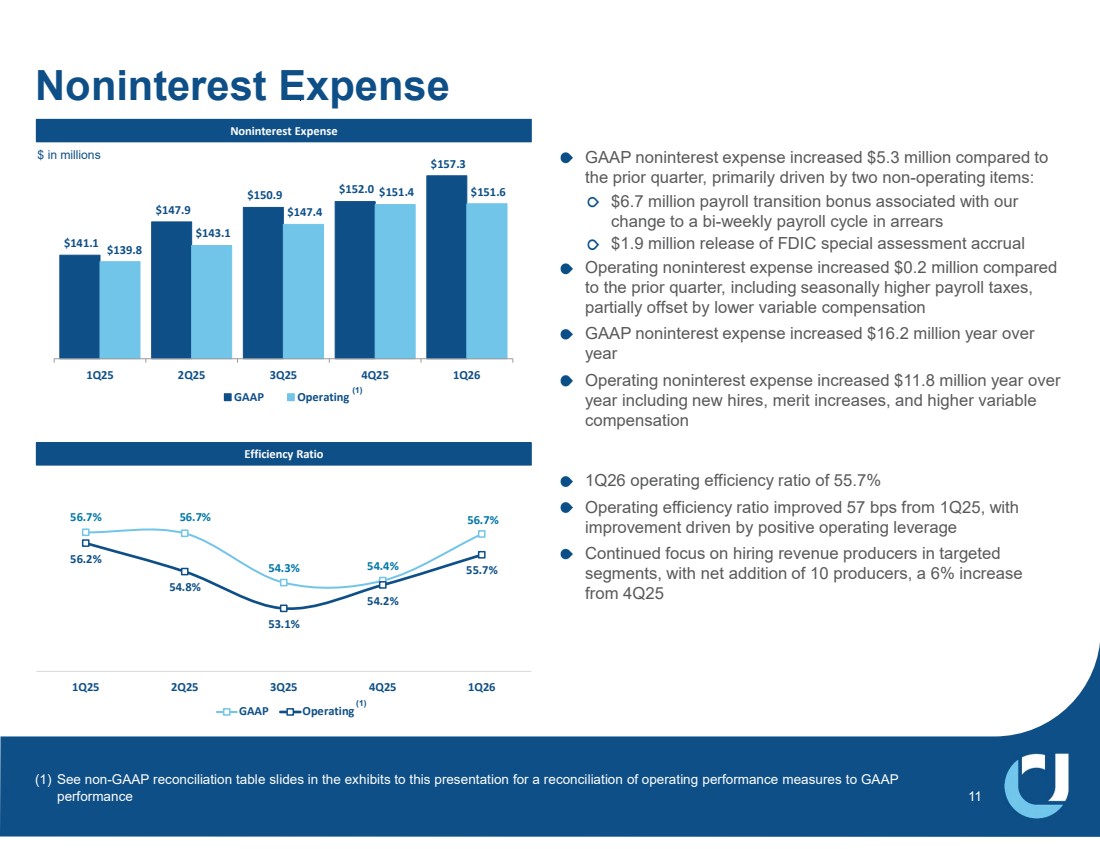
| $141.1 $147.9 $150.9 $152.0 $157.3 $139.8 $143.1 $147.4 $151.4 $151.6 1Q25 2Q25 3Q25 4Q25 1Q26 GAAP Operating Noninterest Expense 1Q26 operating efficiency ratio of 55.7% Operating efficiency ratio improved 57 bps from 1Q25, with improvement driven by positive operating leverage Continued focus on hiring revenue producers in targeted segments, with net addition of 10 producers, a 6% increase from 4Q25 Efficiency Ratio Noninterest Expense 56.7% 56.7% 54.3% 54.4% 56.7% 56.2% 54.8% 53.1% 54.2% 55.7% 1Q25 2Q25 3Q25 4Q25 1Q26 GAAP Operating GAAP noninterest expense increased $5.3 million compared to the prior quarter, primarily driven by two non-operating items: $6.7 million payroll transition bonus associated with our change to a bi-weekly payroll cycle in arrears $1.9 million release of FDIC special assessment accrual Operating noninterest expense increased $0.2 million compared to the prior quarter, including seasonally higher payroll taxes, partially offset by lower variable compensation GAAP noninterest expense increased $16.2 million year over year Operating noninterest expense increased $11.8 million year over year including new hires, merit increases, and higher variable compensation 11 (1) See non-GAAP reconciliation table slides in the exhibits to this presentation for a reconciliation of operating performance measures to GAAP performance (1) $ in millions (1) |
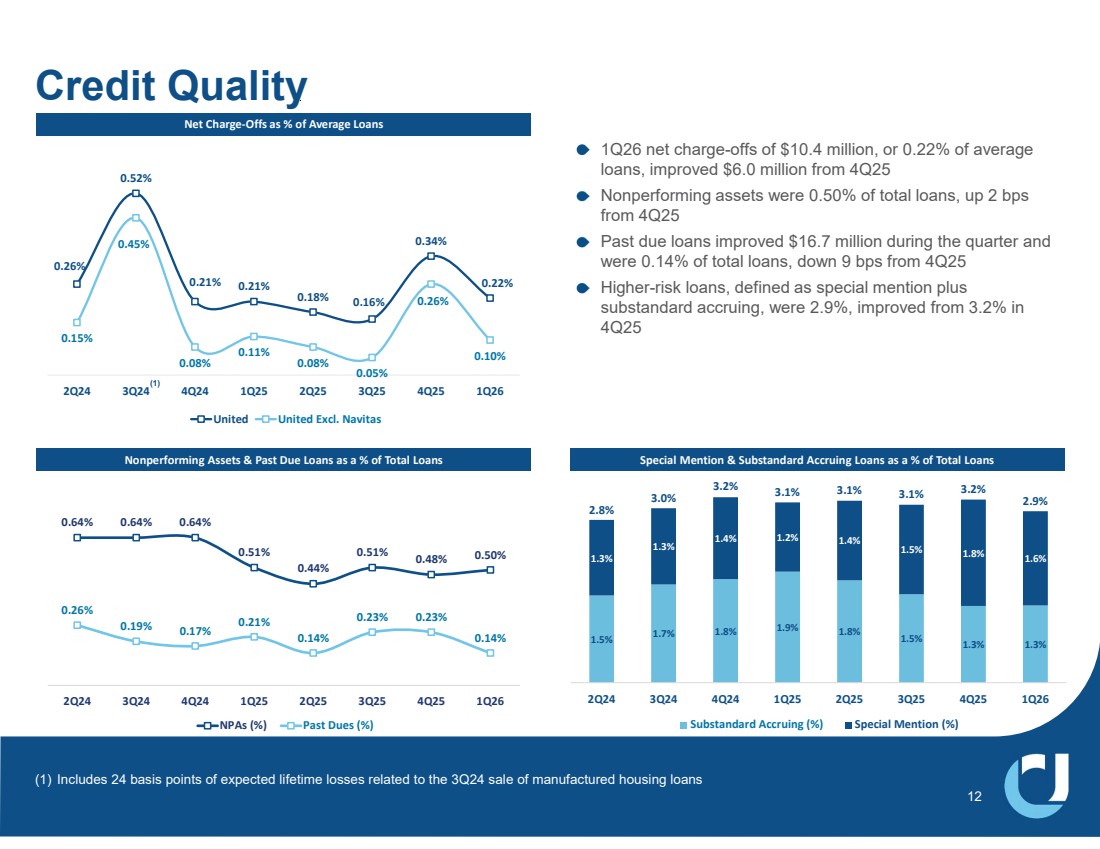
| 1Q26 net charge-offs of $10.4 million, or 0.22% of average loans, improved $6.0 million from 4Q25 Nonperforming assets were 0.50% of total loans, up 2 bps from 4Q25 Past due loans improved $16.7 million during the quarter and were 0.14% of total loans, down 9 bps from 4Q25 Higher-risk loans, defined as special mention plus substandard accruing, were 2.9%, improved from 3.2% in 4Q25 Credit Quality Net Charge-Offs as % of Average Loans Nonperforming Assets & Past Due Loans as a % of Total Loans 0.64% 0.64% 0.64% 0.51% 0.44% 0.51% 0.48% 0.50% 0.26% 0.19% 0.17% 0.21% 0.14% 0.23% 0.23% 0.14% 2Q24 3Q24 4Q24 1Q25 2Q25 3Q25 4Q25 1Q26 NPAs (%) Past Dues (%) 1.5% 1.7% 1.8% 1.9% 1.8% 1.5% 1.3% 1.3% 1.3% 1.3% 1.4% 1.2% 1.4% 1.5% 1.8% 1.6% 2.8% 3.0% 3.2% 3.1% 3.1% 3.1% 3.2% 2.9% 2Q24 3Q24 4Q24 1Q25 2Q25 3Q25 4Q25 1Q26 Substandard Accruing (%) Special Mention (%) Special Mention & Substandard Accruing Loans as a % of Total Loans 12 0.26% 0.52% 0.21% 0.21% 0.18% 0.16% 0.34% 0.22% 0.15% 0.45% 0.08% 0.11% 0.08% 0.05% 0.26% 0.10% 2Q24 3Q24 4Q24 1Q25 2Q25 3Q25 4Q25 1Q26 United United Excl. Navitas (1) Includes 24 basis points of expected lifetime losses related to the 3Q24 sale of manufactured housing loans (1) |
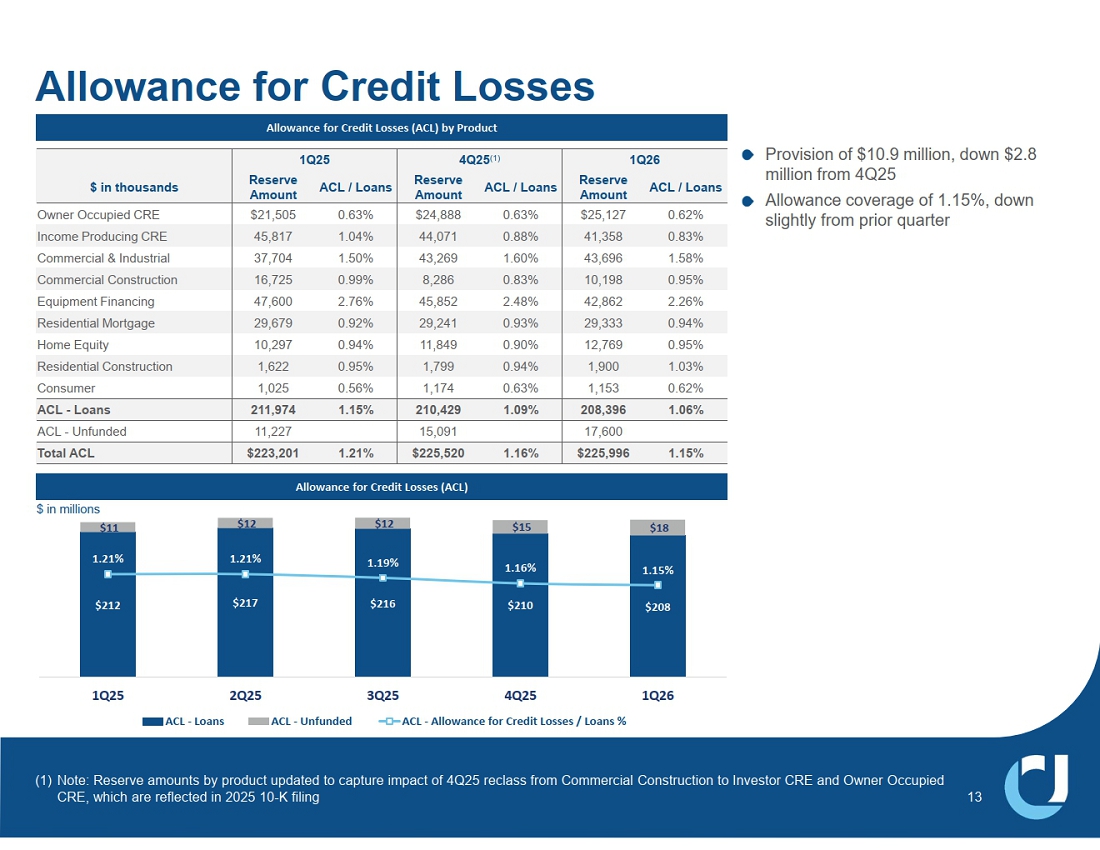
| Allowance for Credit Losses Allowance for Credit Losses (ACL) by Product Allowance for Credit Losses (ACL) Provision of $10.9 million, down $2.8 million from 4Q25 Allowance coverage of 1.15%, down slightly from prior quarter $212 $217 $216 $210 $208 $11 $12 $12 $15 $18 1.21% 1.21% 1.19% 1.16% 1.15% 0.65% 0.75% 0.85% 0.95% 1.05% 1.15% 1.25% 1.35% 1.45% 1.55% $50 $70 $90 $110 $130 $150 $170 $190 $210 $230 1Q25 2Q25 3Q25 4Q25 1Q26 ACL - Loans ACL - Unfunded ACL - Allowance for Credit Losses / Loans % 13 $ in millions 1Q25 4Q25(1) 1Q26 ACL / Loans Reserve Amount ACL / Loans Reserve Amount ACL / Loans Reserve Amount $ in thousands Owner Occupied CRE 21,505 0.63% 24,888 0.63% 25,127 0.62% Income Producing CRE 45,817 1.04% 44,071 0.88% 41,358 0.83% Commercial & Industrial 37,704 1.50% 43,269 1.60% 43,696 1.58% Commercial Construction 16,725 0.99% 8,286 0.83% 10,198 0.95% Equipment Financing 47,600 2.76% 45,852 2.48% 42,862 2.26% Residential Mortgage 29,679 0.92% 29,241 0.93% 29,333 0.94% Home Equity 10,297 0.94% 11,849 0.90% 12,769 0.95% Residential Construction 1,622 0.95% 1,799 0.94% 1,900 1.03% Consumer 1,025 0.56% 1,174 0.63% 1,153 0.62% ACL - Loans 211,974 1.15% 210,429 1.09% 208,396 1.06% ACL - Unfunded 11,227 15,091 17,600 Total ACL $223,201 1.21% $225,520 1.16% $225,996 1.15% (1) Note: Reserve amounts by product updated to capture impact of 4Q25 reclass from Commercial Construction to Investor CRE and Owner Occupied CRE, which are reflected in 2025 10-K filing |
| Member FDIC © 2026 United Community Bank | ucbi.com 1Q26 INVESTOR PRESENTATION Exhibits |

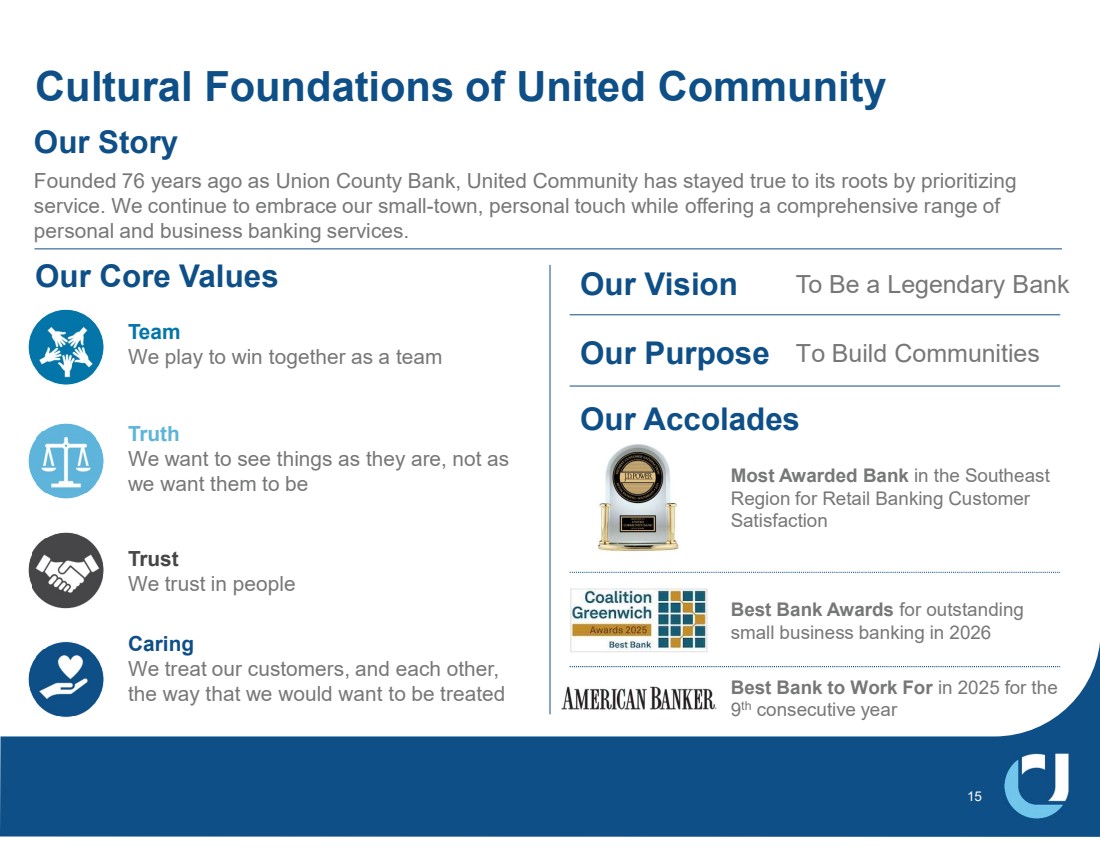
| Cultural Foundations of United Community 15 Our Story Founded 76 years ago as Union County Bank, United Community has stayed true to its roots by prioritizing service. We continue to embrace our small-town, personal touch while offering a comprehensive range of personal and business banking services. Team We play to win together as a team Truth We want to see things as they are, not as we want them to be Trust We trust in people Caring We treat our customers, and each other, the way that we would want to be treated Best Bank to Work For in 2025 for the 9 th consecutive year Most Awarded Bank in the Southeast Region for Retail Banking Customer Satisfaction Best Bank Awards for outstanding small business banking in 2026 Our Core Values Our Vision To Be a Legendary Bank Our Accolades Our Purpose To Build Communities |
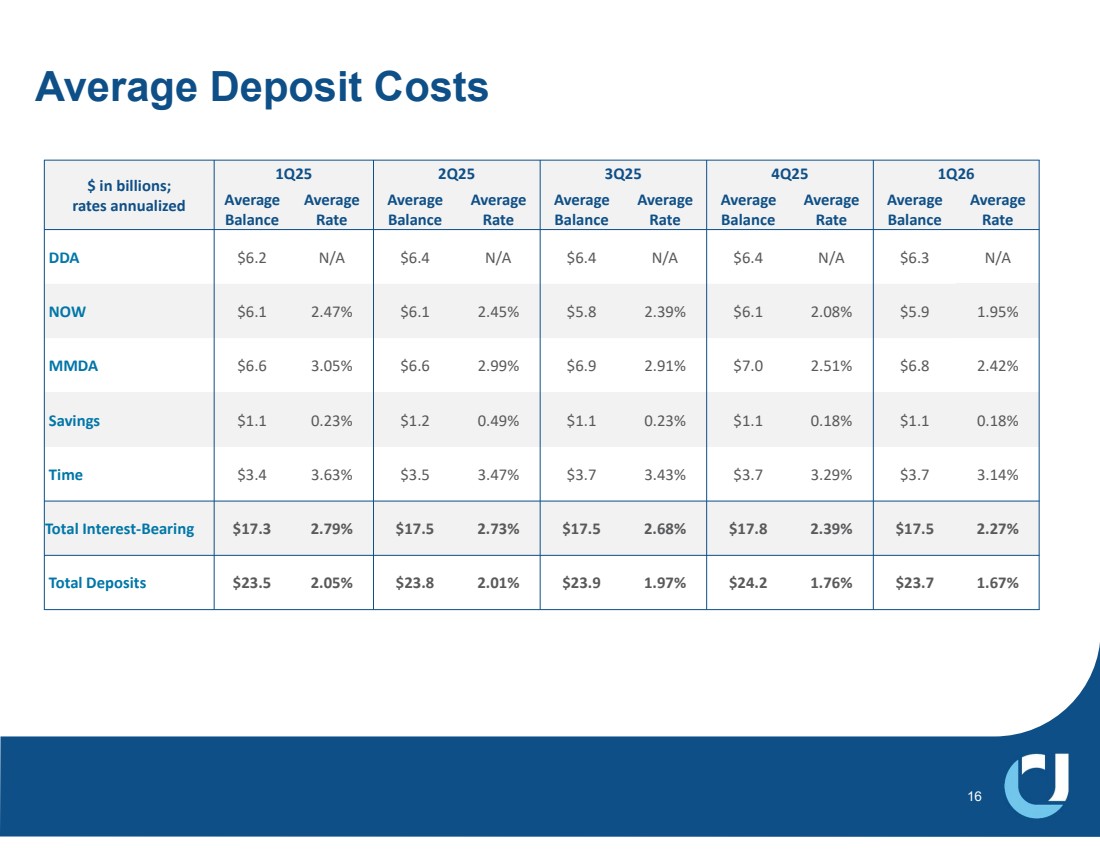
| Average Deposit Costs 16 1Q25 2Q25 3Q25 4Q25 1Q26 $ in billions; rates annualized Average Rate Average Balance Average Rate Average Balance Average Rate Average Balance Average Rate Average Balance Average Rate Average Balance DDA $6.2 N/A $6.4 N/A $6.4 N/A $6.4 N/A $6.3 N/A NOW $6.1 2.47% $6.1 2.45% $5.8 2.39% $6.1 2.08% $5.9 1.95% MMDA $6.6 3.05% $6.6 2.99% $6.9 2.91% $7.0 2.51% $6.8 2.42% Savings $1.1 0.23% $1.2 0.49% $1.1 0.23% $1.1 0.18% $1.1 0.18% Time $3.4 3.63% $3.5 3.47% $3.7 3.43% $3.7 3.29% $3.7 3.14% Total Interest-Bearing $17.3 2.79% $17.5 2.73% $17.5 2.68% $17.8 2.39% $17.5 2.27% Total Deposits $23.5 2.05% $23.8 2.01% $23.9 1.97% $24.2 1.76% $23.7 1.67% |
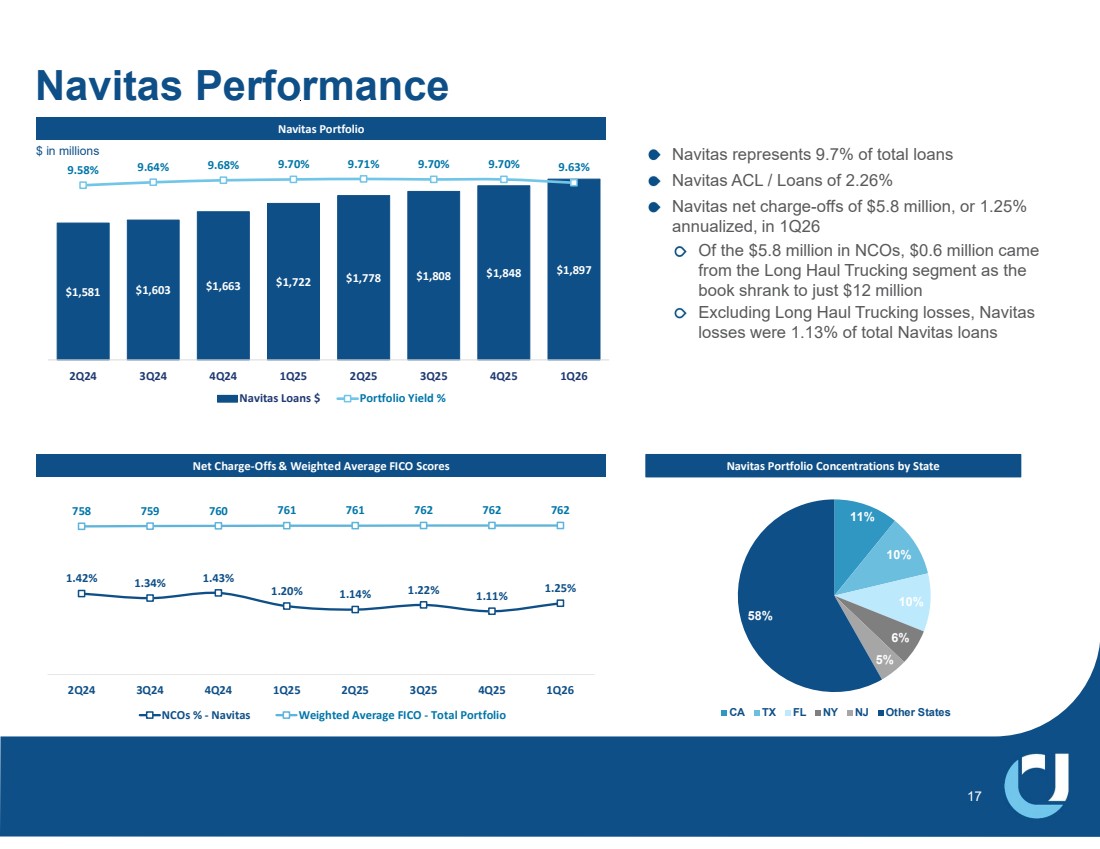
| Navitas Portfolio Net Charge-Offs & Weighted Average FICO Scores Navitas represents 9.7% of total loans Navitas ACL / Loans of 2.26% Navitas net charge-offs of $5.8 million, or 1.25% annualized, in 1Q26 Of the $5.8 million in NCOs, $0.6 million came from the Long Haul Trucking segment as the book shrank to just $12 million Excluding Long Haul Trucking losses, Navitas losses were 1.13% of total Navitas loans Navitas Performance $1,581 $1,603 $1,663 $1,722 $1,778 $1,808 $1,848 $1,897 9.58% 9.64% 9.68% 9.70% 9.71% 9.70% 9.70% 9.63% 2Q24 3Q24 4Q24 1Q25 2Q25 3Q25 4Q25 1Q26 Navitas Loans $ Portfolio Yield % 17 1.42% 1.34% 1.43% 1.20% 1.14% 1.22% 1.11% 1.25% 758 759 760 761 761 762 762 762 2Q24 3Q24 4Q24 1Q25 2Q25 3Q25 4Q25 1Q26 NCOs % - Navitas Weighted Average FICO - Total Portfolio $ in millions Navitas Portfolio Concentrations by State 11% 10% 10% 6% 5% 58% CA TX FL NY NJ Other States |
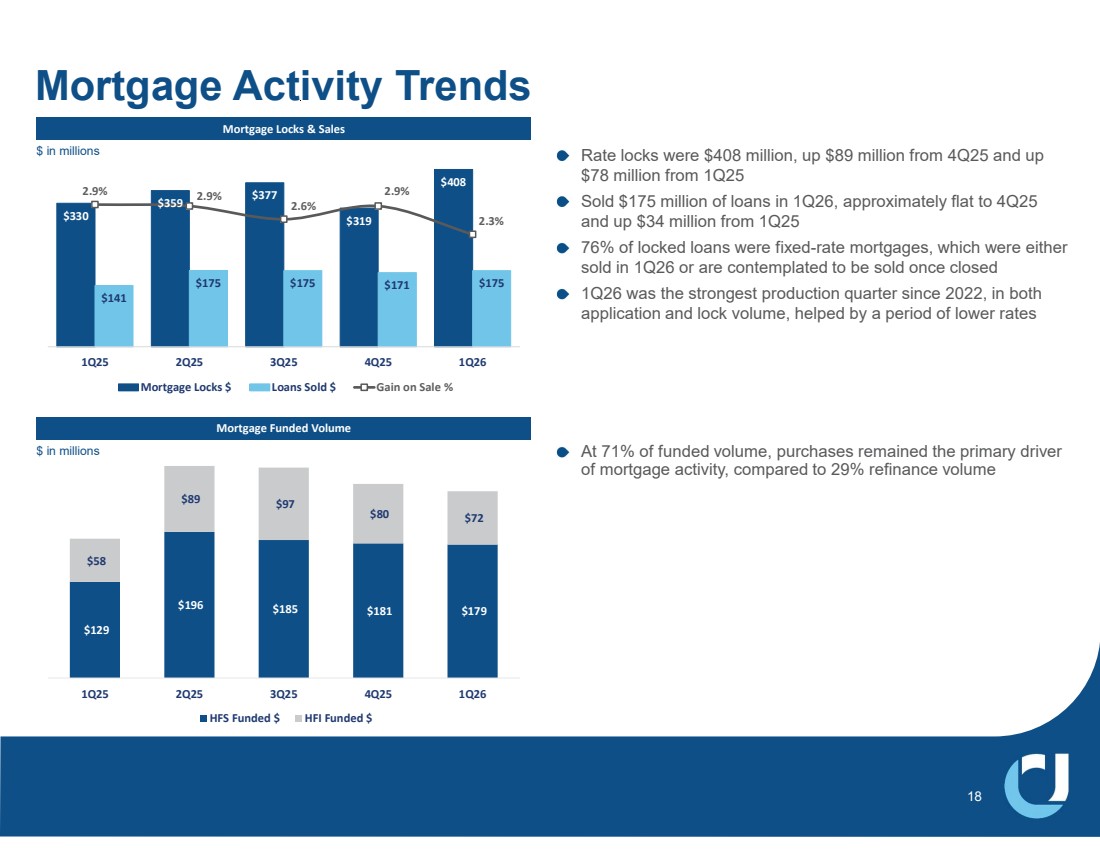
| Rate locks were $408 million, up $89 million from 4Q25 and up $78 million from 1Q25 Sold $175 million of loans in 1Q26, approximately flat to 4Q25 and up $34 million from 1Q25 76% of locked loans were fixed-rate mortgages, which were either sold in 1Q26 or are contemplated to be sold once closed 1Q26 was the strongest production quarter since 2022, in both application and lock volume, helped by a period of lower rates Mortgage Locks & Sales Mortgage Funded Volume Mortgage Activity Trends $330 $359 $377 $319 $408 $141 $175 $175 $171 $175 2.9% 2.9% 2.6% 2.9% 2.3% 1Q25 2Q25 3Q25 4Q25 1Q26 Mortgage Locks $ Loans Sold $ Gain on Sale % $129 $196 $185 $181 $179 $58 $89 $97 $80 $72 1Q25 2Q25 3Q25 4Q25 1Q26 HFS Funded $ HFI Funded $ 18 At 71% of funded volume, purchases remained the primary driver of mortgage activity, compared to 29% refinance volume $ in millions $ in millions |
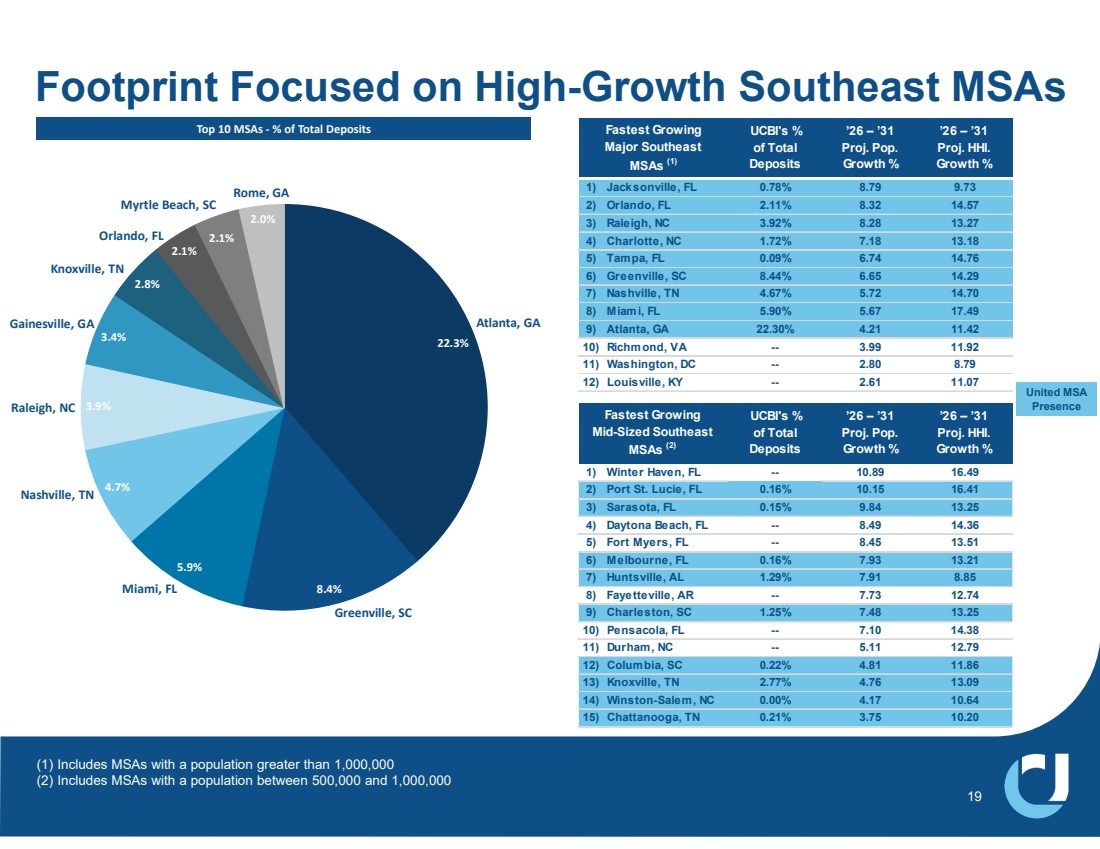
| (1) Includes MSAs with a population greater than 1,000,000 (2) Includes MSAs with a population between 500,000 and 1,000,000 Footprint Focused on High-Growth Southeast MSAs 19 22.3% 8.4% 5.9% 4.7% 3.9% 3.4% 2.8% 2.1% 2.1% 2.0% Atlanta, GA Greenville, SC Nashville, TN Miami, FL Raleigh, NC Gainesville, GA Knoxville, TN Orlando, FL Rome, GA Myrtle Beach, SC Top 10 MSAs - % of Total Deposits UCBI's % of Total Deposits ’26 – ’31 Proj. Pop. Growth % ’26 – ’31 Proj. HHI. Growth % 1) Jacksonville, FL 0.78% 8.79 9.73 2) Orlando, FL 2.11% 8.32 14.57 3) Raleigh, NC 3.92% 8.28 13.27 4) Charlotte, NC 1.72% 7.18 13.18 5) Tampa, FL 0.09% 6.74 14.76 6) Greenville, SC 8.44% 6.65 14.29 7) Nashville, TN 4.67% 5.72 14.70 8) Miami, FL 5.90% 5.67 17.49 9) Atlanta, GA 22.30% 4.21 11.42 10) Richmond, VA -- 3.99 11.92 11) Washington, DC -- 2.80 8.79 12) Louisville, KY -- 2.61 11.07 Fastest Growing Major Southeast MSAs (1) United MSA Presence UCBI's % of Total Deposits ’26 – ’31 Proj. Pop. Growth % ’26 – ’31 Proj. HHI. Growth % 1) Winter Haven, FL -- 10.89 16.49 2) Port St. Lucie, FL 0.16% 10.15 16.41 3) Sarasota, FL 0.15% 9.84 13.25 4) Daytona Beach, FL -- 8.49 14.36 5) Fort Myers, FL -- 8.45 13.51 6) Melbourne, FL 0.16% 7.93 13.21 7) Huntsville, AL 1.29% 7.91 8.85 8) Fayetteville, AR -- 7.73 12.74 9) Charleston, SC 1.25% 7.48 13.25 10) Pensacola, FL -- 7.10 14.38 11) Durham, NC -- 5.11 12.79 12) Columbia, SC 0.22% 4.81 11.86 13) Knoxville, TN 2.77% 4.76 13.09 14) Winston-Salem, NC 0.00% 4.17 10.64 15) Chattanooga, TN 0.21% 3.75 10.20 Fastest Growing Mid-Sized Southeast MSAs (2) |
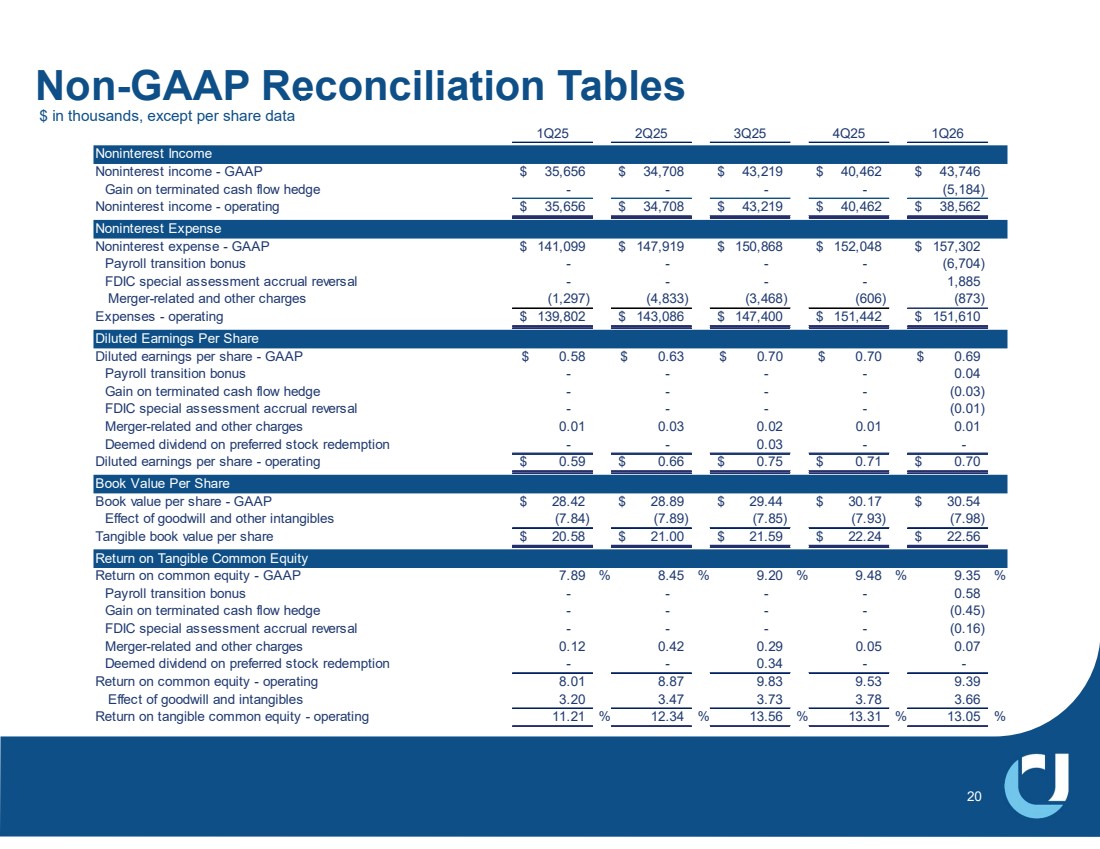
| Non-GAAP Reconciliation Tables 20 1Q25 2Q25 3Q25 4Q25 1Q26 Noninterest Income Noninterest income - GAAP 35,656 $ 34,708 $ 43,219 $ 40,462 $ 43,746 $ Gain on terminated cash flow hedge - - - - (5,184) Noninterest income - operating 35,656 $ 34,708 $ 43,219 $ 40,462 $ 38,562 $ Noninterest Expense Noninterest expense - GAAP 141,099 $ 147,919 $ 150,868 $ 152,048 $ 157,302 $ Payroll transition bonus - - - - (6,704) FDIC special assessment accrual reversal - - - - 1,885 Merger-related and other charges (1,297) (4,833) (3,468) (606) (873) Expenses - operating 139,802 $ 143,086 $ 147,400 $ 151,442 $ 151,610 $ Diluted Earnings Per Share Diluted earnings per share - GAAP 0.58 $ 0.63 $ 0.70 $ 0.70 $ 0.69 $ Payroll transition bonus - - - - 0.04 Gain on terminated cash flow hedge - - - - (0.03) FDIC special assessment accrual reversal - - - - (0.01) Merger-related and other charges 0.01 0.03 0.02 0.01 0.01 Deemed dividend on preferred stock redemption - - 0.03 - - Diluted earnings per share - operating 0.59 $ 0.66 $ 0.75 $ 0.71 $ 0.70 $ Book Value Per Share Book value per share - GAAP 28.42 $ 28.89 $ 29.44 $ 30.17 $ 30.54 $ Effect of goodwill and other intangibles (7.84) (7.89) (7.85) (7.93) (7.98) Tangible book value per share 20.58 $ 21.00 $ 21.59 $ 22.24 $ 22.56 $ Return on Tangible Common Equity Return on common equity - GAAP 7.89 % 8.45 % 9.20 % 9.48 % 9.35 % Payroll transition bonus - - - - 0.58 Gain on terminated cash flow hedge - - - - (0.45) FDIC special assessment accrual reversal - - - - (0.16) Merger-related and other charges 0.12 0.42 0.29 0.05 0.07 Deemed dividend on preferred stock redemption - - 0.34 - - Return on common equity - operating 8.01 8.87 9.83 9.53 9.39 Effect of goodwill and intangibles 3.20 3.47 3.73 3.78 3.66 Return on tangible common equity - operating 11.21 % 12.34 % 13.56 % 13.31 % 13.05 % $ in thousands, except per share data |
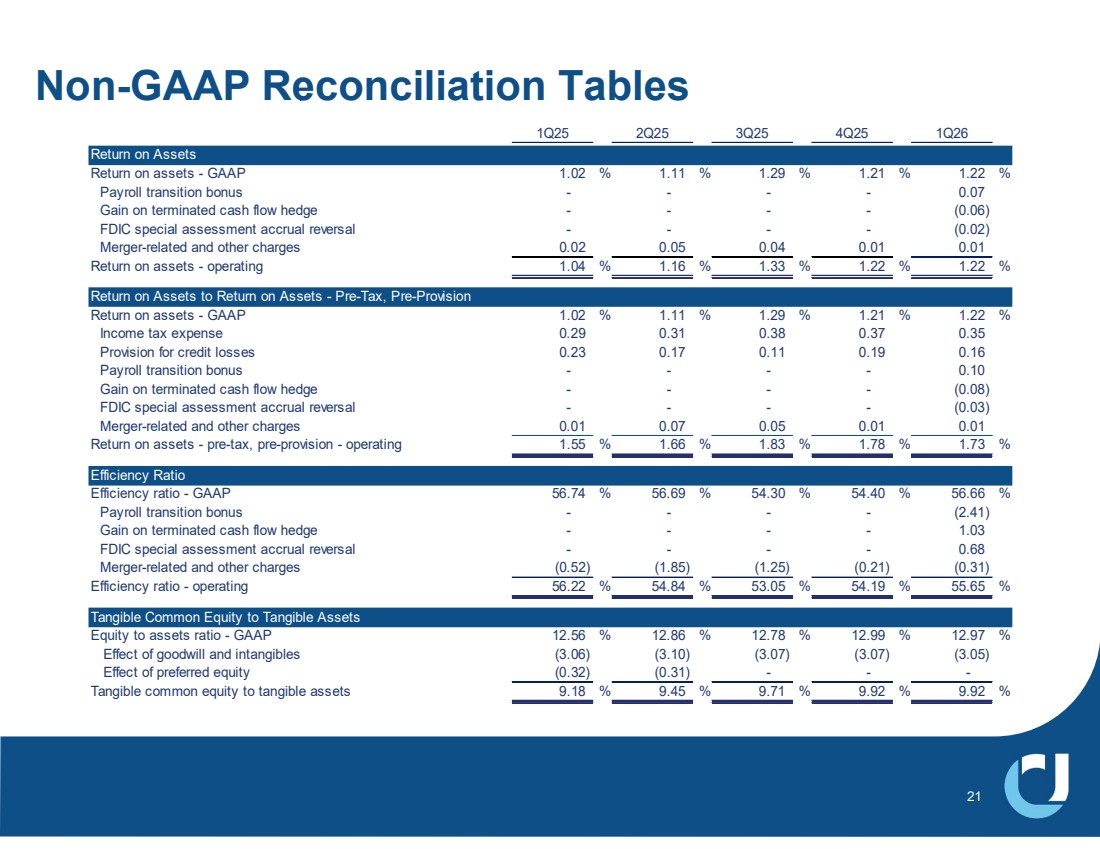
| Non-GAAP Reconciliation Tables 21 1Q25 2Q25 3Q25 4Q25 1Q26 Return on Assets Return on assets - GAAP 1.02 % 1.11 % 1.29 % 1.21 % 1.22 % Payroll transition bonus - - - - 0.07 Gain on terminated cash flow hedge - - - - (0.06) FDIC special assessment accrual reversal - - - - (0.02) Merger-related and other charges 0.02 0.05 0.04 0.01 0.01 Return on assets - operating 1.04 % 1.16 % 1.33 % 1.22 % 1.22 % Return on Assets to Return on Assets - Pre-Tax, Pre-Provision Return on assets - GAAP 1.02 % 1.11 % 1.29 % 1.21 % 1.22 % Income tax expense 0.29 0.31 0.38 0.37 0.35 Provision for credit losses 0.23 0.17 0.11 0.19 0.16 Payroll transition bonus - - - - 0.10 Gain on terminated cash flow hedge - - - - (0.08) FDIC special assessment accrual reversal - - - - (0.03) Merger-related and other charges 0.01 0.07 0.05 0.01 0.01 Return on assets - pre-tax, pre-provision - operating 1.55 % 1.66 % 1.83 % 1.78 % 1.73 % Efficiency Ratio Efficiency ratio - GAAP 56.74 % 56.69 % 54.30 % 54.40 % 56.66 % Payroll transition bonus - - - - (2.41) Gain on terminated cash flow hedge - - - - 1.03 FDIC special assessment accrual reversal - - - - 0.68 Merger-related and other charges (0.52) (1.85) (1.25) (0.21) (0.31) Efficiency ratio - operating 56.22 % 54.84 % 53.05 % 54.19 % 55.65 % Tangible Common Equity to Tangible Assets Equity to assets ratio - GAAP 12.56 % 12.86 % 12.78 % 12.99 % 12.97 % Effect of goodwill and intangibles (3.06) (3.10) (3.07) (3.07) (3.05) Effect of preferred equity (0.32) (0.31) - - - Tangible common equity to tangible assets 9.18 % 9.45 % 9.71 % 9.92 % 9.92 % |
| Glossary ACL – Allowance for Credit Losses MH – Manufactured Housing ALLL – Allowance for Loan Losses MLO – Mortgage Loan Office AOCI – Accumulated Other Comprehensive Income (Loss) MMDA – Money Market Deposit Account AUM – Assets Under Management MTM – Marked-to-Market BPS – Basis Points MSA – Metropolitan Statistical Area C&I – Commercial and Industrial MSR – Mortgage Servicing Rights Asset C&D – Construction and Development NCO – Net Charge-Offs CECL – Current Expected Credit Losses NIM – Net Interest Margin CET1 – Common Equity Tier 1 Capital NOW – Negotiable Order of Withdrawal CRE – Commercial Real Estate NPA – Non-Performing Asset DDA – Demand Deposit Account OO CRE – Owner Occupied Commercial Real Estate EOP – End of Period PCD – Loans Purchased with Credit Deterioration EPS – Earnings Per Share PTPP – Pre-Tax, Pre-Provision Earnings FTE – Fully-Taxable Equivalent RBC – Risk Based Capital GAAP – Accounting Principles Generally Accepted in the USA ROA – Return on Assets HELOC – Home Equity Line of Credit SBA – United States Small Business Administration IBL – Interest-Bearing Liabilities TCE – Tangible Common Equity KRX – KBW Nasdaq Regional Banking Index USDA – United States Department of Agriculture LPO – Loan Production Office YOY – Year over Year 22 |